


 EUR/USD Slips Below 1.1380 as US-Iran Tensions Fuel Dollar Demand
  FxWirePro: USD/CAD runs out of steam but maintains bullish outlook
  BTCUSD Bullish Breakout: Clears 800-EMA After Consolidation, Buy Dips Toward $74,900
  FxWirePro- Major Pair levels and bias summary
  FxWirePro: AUD/USD slips on risk aversion as Middle East tensions escalate
  FxWirePro- Major Pair levels and bias summary
  USD/CHF Surges on Broad Dollar Buying, Eyes 0.8200 Next
  FxWirePro- Major Crypto levels and bias summary


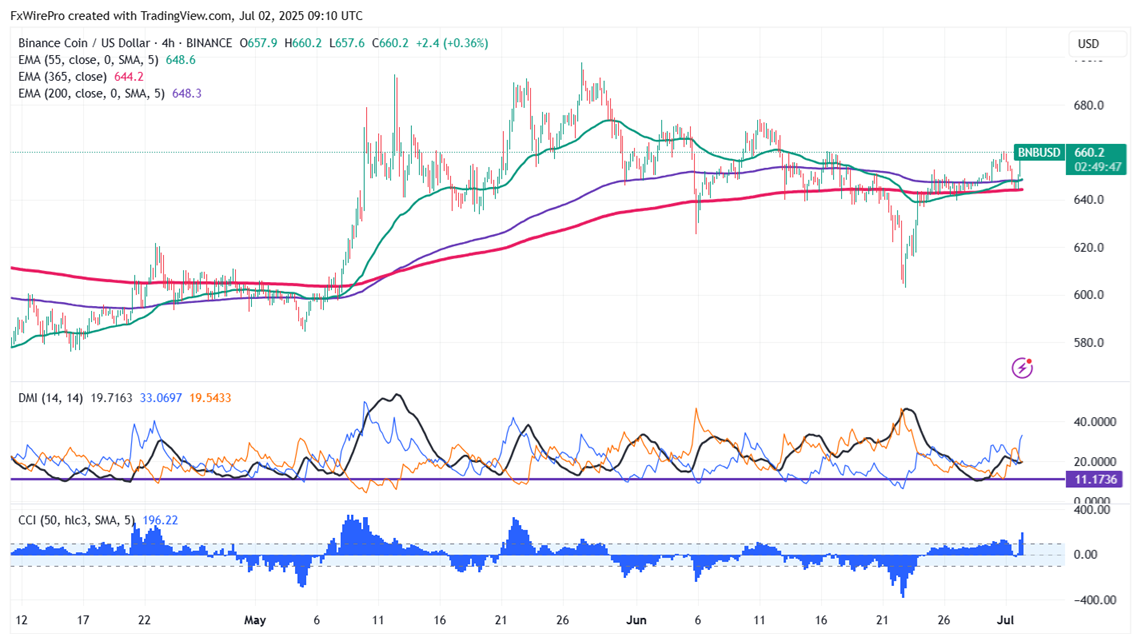
BNB/USD breaks two-week high after a long consolidation. It hits a high of $660.30 and is currently trading around $660.10.
Short-term trend remains bullish as long as the support $598 holds. It trades above the 55 and 34, 200 and 365 EMA on the 4-hour chart. Near-term support is around $644 (365- EMA), any close below targets $628/$598/$570/$520. If the pair closes below $500, potentially lead to further declines towards $400.
Immediate Resistance is at $661.Any breakout above this resistance confirms bullish momentum and a jump towards $669/$680/$730/$800/$1000.
Indicators (4-hour Chart)
- Directional Movement Index: Neutral
- CCI (50): Bullish
Trading Strategy
It is good to buy on dips around $650 with a stop-loss set at $635 and a target price of $800/$1000.


