BNB Soars: A Bullish Ride Towards $1000?
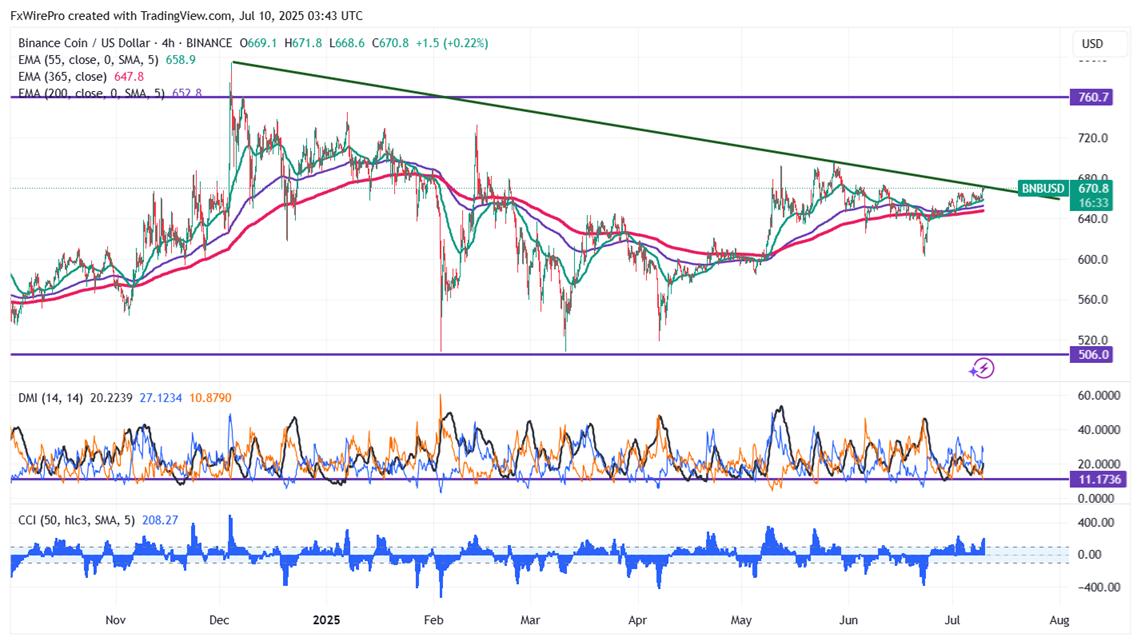
BNB/USD trades higher following the footsteps of Bitcoin. It hits an intraday high of $671.80 and is currently trading around $670.70.
Short-term trend remains bullish as long as the support $598 holds. It trades above the 55 and 34 EMA on the 4-hour chart. Near-term support is around $648 (365- HEMA); any close below targets $ 644, $628, $598, $570, or $520. If the pair closes below $500, potentially lead to further declines towards $400.
Immediate Resistance is at $672 (trendline resistance). Any breakout above this resistance confirms bullish momentum and a jump towards $680/$730/$800/$1000.
Indicators (4-hour Chart)
- Directional Movement Index: Neutral
- CCI (50): Bullish
Trading Strategy
It is good to buy on dips around $660 with a stop-loss set at $635 and a target price of $800/$1000.