


 FxWirePro: USD/CAD trades in tight range as markets track Middle East conflict
  FxWirePro : USD/JPY holds bullish bias despite intervention concerns
  NZDJPY Bulls Hold the Line: 92.60 Support Fuels Dip-Buy Setup to 95
  FxWirePro: USD/CAD runs out of steam but maintains bullish outlook
  FxWirePro: AUD/USD edges higher as USD weakens broadly
  FxWirePro: AUD/USD slips on risk aversion as Middle East tensions escalate
  FxWirePro- Major Crypto levels and bias summary
  FxWirePro: USD/ CNY gains some ground but bearish outlook persists
  FxWirePro- Major Crypto levels and bias summary
  FxWirePro: GBP/AUD steadies around 1.9310,retains bid tone


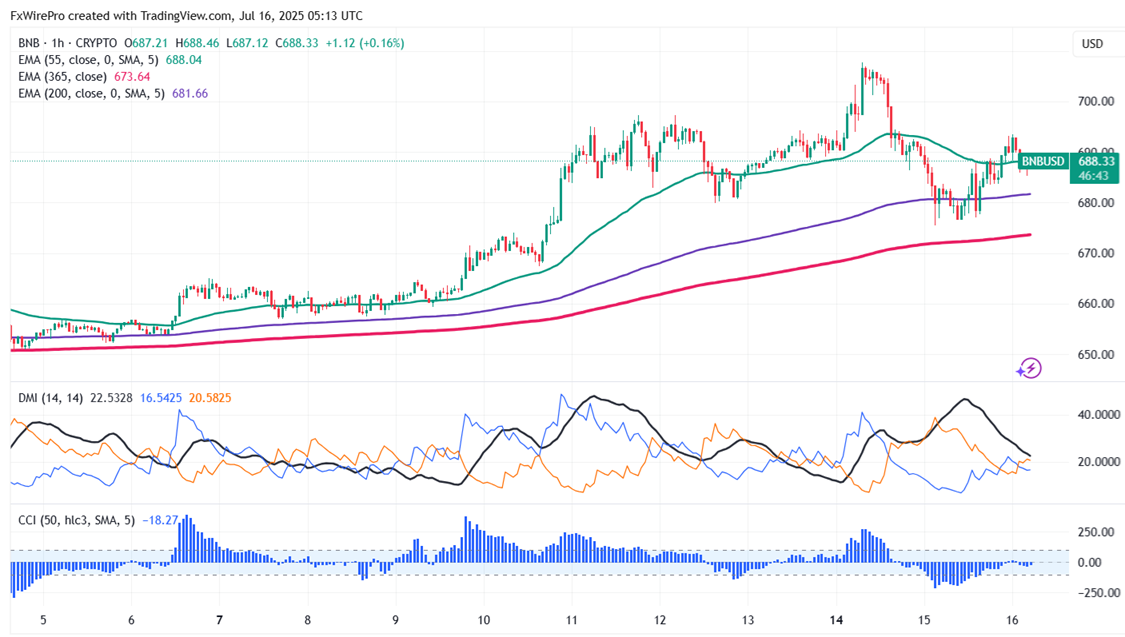
BNB/USD took support near 365 H EMA and showed a minor pullback. It hits an intraday high of $693 and is currently trading around $687.89.
The short-term trend remains bullish as long as the support level of $598 holds. It trades above the 55 and 34, 200 and 365 EMA on the 1- hour chart. Near-term support is around $670; any close below targets $ 650, $644, $628, $598, $570, or $520. If the pair closes below $500, potentially lead to further declines towards $400.
Immediate Resistance is at $710.Any breakout above this resistance confirms bullish momentum and a jump towards $730/$800/$1000.
Indicators (1- hour Chart)
Directional Movement Index: Neutral
CCI (50): Bearish
Trading Strategy
It is good to buy on dips around $675 with a stop-loss set at $650 and a target price of $800/$1000.

- News

- Economy

- Central Banks
- Investing
- Research
- Roundups
- Digital Currency
- Insights
- Technical Analysis
- Technology
- Business
- Law
- Health
- Nature
- Fintech
- Science
- Topic
- Opinions
- ©Econometrics LLC . All Rights Reserved.
BNB/USD Surges After Holding 365 EMA—Can Bulls Hit $800?
Wednesday, July 16, 2025 5:26 AM UTC
Editor's Picks


- Market Data
Most Popular


