BTC/USD breaks major resistance $245, jump till $272 is possible
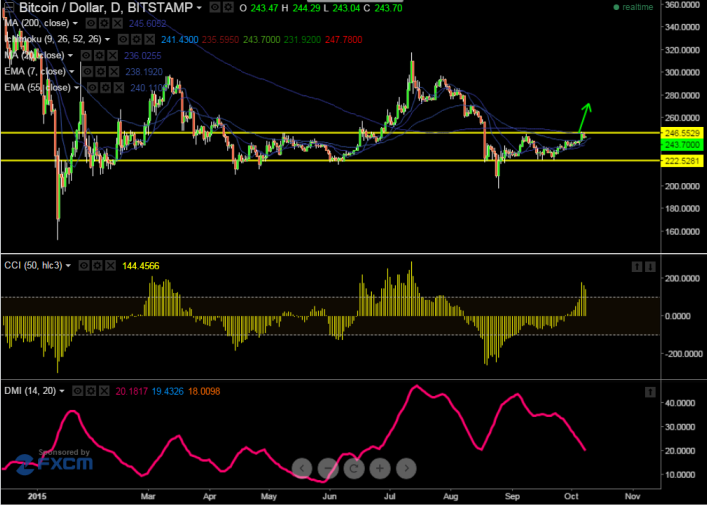
BTC/USD has broken major resistance $245 (200 day 4 HMA) and this confirms short term bullishness, a jump till $258/$272 is possible It is currently trading at $244.91. Short term trend is bullish as long as support $235…
BTC/USD has broken major resistance $245 (200 day 4 HMA) and this confirms short term bullishness, a jump till $258/$272 is possible It is currently trading at $244.91. Short term trend is bullish as long as support $235 holds.
The major resistance is around $245 and break above will take the pair to next target $258/$272.
The pair's minor support is around $235 and any break below will drag the pair further down till $228/$220.
Bullish invalidation only below $220
Indicator (Daily chart)
CCI (50) -Buy
Ichimoku- Buy
We prefer to buy around $240-242 with SL around $234.50 for the TP of $258/$272