


 BTC’s Bear Bounce: Sell the Rally Near $66K as Bears Target $59K–$52K Breakdown
  Peace Dividend Powers NZDJPY Past 93.50 — Bulls Set Sights on 96.15 Target
  FxWirePro: NZD/USD jumps after US and Iran agree preliminary deal
  Sell the Bounce: NZDJPY Bearish Bias Persists Below 94.20, Eyes 90.50
  FxWirePro: EUR/AUD loses upside momentum but outlook is bullish
  FxWirePro: USD/ZAR edges higher, set to stay on back foot
  FxWirePro: GBP/NZD stuck in range but outlook is bullish
  Relief Rally Extends to 112.75, but AUDJPY EMA Structure Favors Selling
  GBPJPY Coil Tightens: Is a Bullish Break Above 215.60 Imminent?
  FxWirePro: EUR/ NZD uptrend loses steam, remains on bullish path
  Geopolitical Easing Fuels AUDJPY Rally Toward 115 — Buy Dips at 113
  FxWirePro: USD/JPY gains above 160 level ahead of BOJ policy meeting


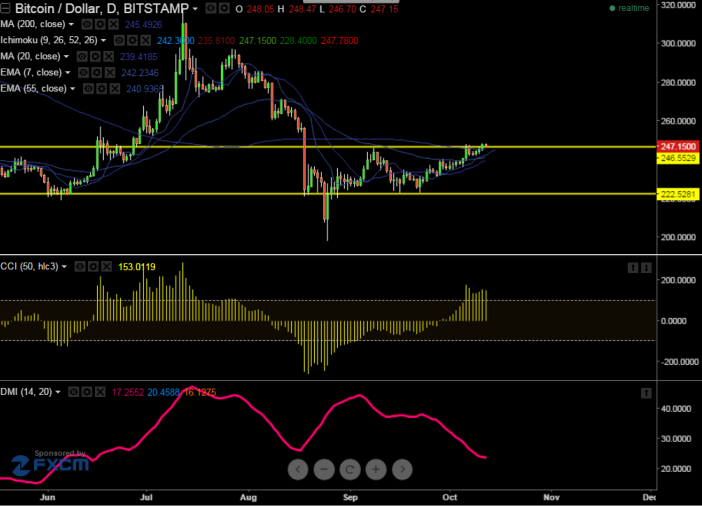
- BTC/USD has broken major resistance $245 (200 day 4 HMA) and this confirms short term bullishness, a jump till $258/$272 is possible It is currently trading at $248. Short term trend is bullish as long as support $235 holds
- The major resistance is around $245 and break above will take the pair to next target $258/$272.
- The pair's minor support is around $235 and any break below will drag the pair further down till $228/$220.
- Bullish invalidation only below $220
Indicator (Daily chart)
CCI (50) -Buy
Ichimoku- Buy
We prefer to buy around $240-242 with SL around $234.50 for the TP of $258/$272


