BTC/USD trades weaker, further jump only above 600
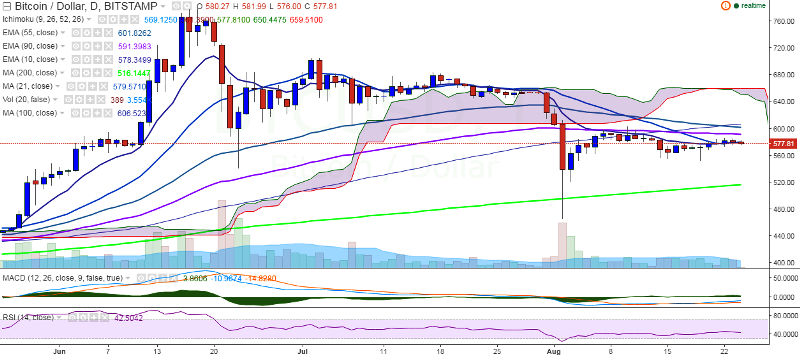
BTC/USD is trading weak on Wednesday and has slipped below 21-day MA. It is currently trading at 576 levels at the time of writing (Bitstamp). Ichimoku analysis of daily chart: Tenkan Sen: 569.12 Kijun Sen: 561.32 Trend …
By Shampa Mani
Updated 1 min read
Image from the original EconoTimes article
BTC/USD is trading weak on Wednesday and has slipped below 21-day MA. It is currently trading at 576 levels at the time of writing (Bitstamp).
Ichimoku analysis of daily chart:
Tenkan Sen: 569.12
Kijun Sen: 561.32
Trend reversal: 591.70 (90 EMA)
Long-term trend is bullish for the pair and it faces major resistance at 591.70 (90 EMA) and a break above would target 605 (100-day MA)/634 (161.8% retracement of 603 and 522.30).
On the reverse side, support is likely to be found at 550 (psychological level) and break below would drag the pair to 514 (200-day MA)/465.28 (August 2 low).
XLM's chart readings were bearish on four-hour and weekly views but bullish on the daily chart. The Sunday quote was below Saturday's snapshot, taken at a different time.