


 BTC’s Bear Bounce: Sell the Rally Near $66K as Bears Target $59K–$52K Breakdown
  FxWirePro- Major Crypto levels and bias summary
  FxWirePro- Major Crypto levels and bias summary
  FxWirePro- Major Crypto levels and bias summary
  Ethereum Cracks Under $1,700: Sell the Rally Near $1,750 as Bears Eye $1,380–$1,200
  FxWirePro- Major Crypto levels and bias summary


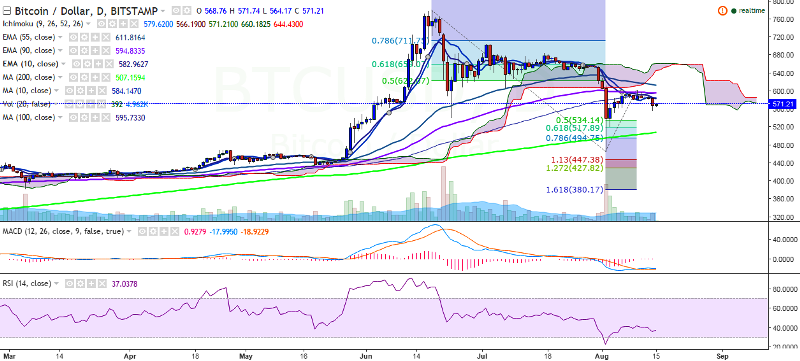
BTC/USD has declined sharply after hitting a high of 603 levels. It has plunged to 556.24 levels and currently trades at 569.75 levels at the time of writing (Bitstamp).
Ichimoku analysis of daily chart:
Tenkan Sen: 579.62
Kijun Sen: 570.14
Trend reversal: 595.36
Short-term trend appears bearish. BTC/USD is trading well below 90 EMA and must break above for further upside. It faces further resistance at 613.32 (55 EMA) and any violation will see the pair testing 659.07 (61.8% retracement of 778.85 and 465.28). On the other hand, the pair is likely to find support at 534.14 (50% retracement of 465.25 and 603) and a break below will drag it to 506 (200-day MA)/465.28.

- News

- Economy

- Central Banks
- Investing
- Research
- Roundups
- Digital Currency
- Insights
- Technical Analysis
- Technology
- Business
- Law
- Health
- Nature
- Fintech
- Science
- Topic
- Opinions
- ©Econometrics LLC . All Rights Reserved.
BTC/USD trades well below 90-day EMA, decline till 534/506 likely
Monday, August 15, 2016 4:31 AM UTC
Editor's Picks


- Market Data
Most Popular


