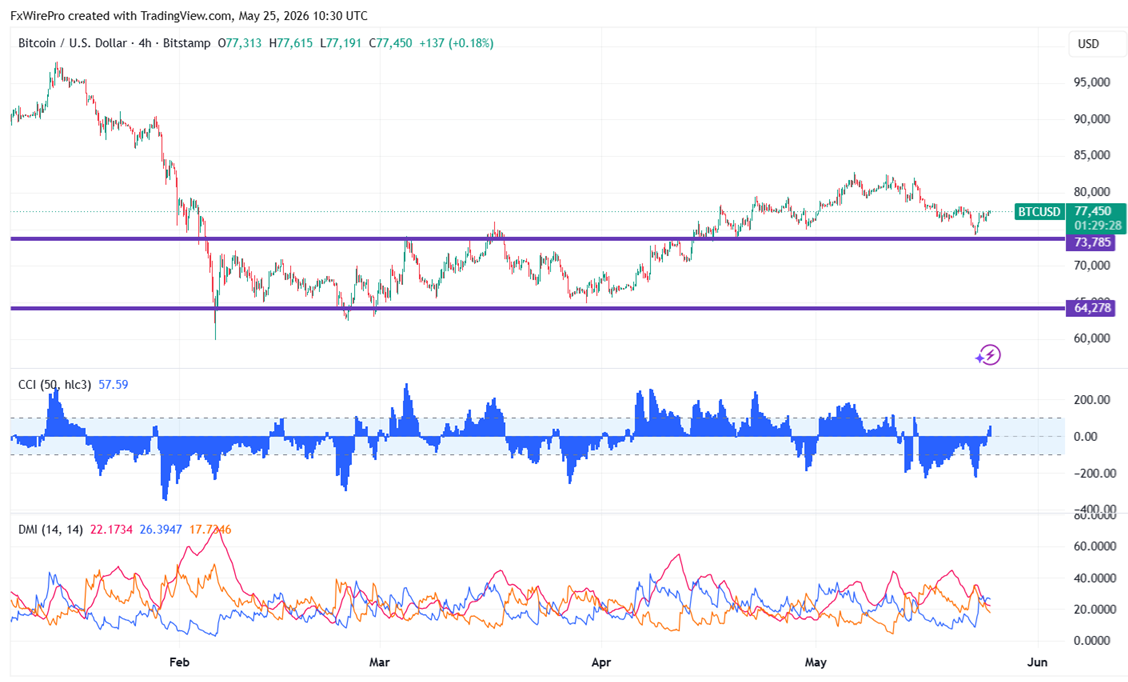
On declining US-Iran geopolitical tension, BTCUSD surged by more than $3000. It has dropped to $74192 and is now trading at about $77526.
|
Technicals |
CMP -$77526 |
Trend |
|
|
4- Hour chart |
Value |
|
|
|
55 EMA |
$77260 |
CMP<55 EMA |
Bullish |
|
200- EMA |
$77462 |
CMP <200- EMA |
Bullish |
|
365- EMA |
$76438 |
CMP>365 EMA |
Bullish |
Major support- $74000/$73290/$70000/$67000/$64000/$60000. Minor bullishness only above $78000. Any break above targets $80000/$82000/$85890/$90000.
|
Momentum indicator (4-hour chart) |
Inference |
Value |
|
CCI(50) |
Bullish |
37.15 |
|
ADX |
Neutral |
|
It is good to buy on dips around $74000 with SL around $70000 for a TP of $82000/$85000.