


 FxWirePro: NZD/USD advances as hawkish outlook by a top policy maker boosts kiwi dollar
  GBPJPY Bullish on Consolidation: Holds Above 216 After 218 Top – Buy Dips at 217 Targeting 220
  FxWirePro- Major Crypto levels and bias summary
  FxWirePro- Major Crypto levels and bias summary
  FxWirePro: NZD/USD steadies around 0.5830,retains bid tone
  Crypto Major Pair Action Bias: ETHUSD Bullish as BTCUSD, SOLUSD & XRPUSD Stay Neutral
  BTCUSD Bullish Breakout: Clears 800-EMA After Consolidation, Buy Dips Toward $74,900
  FxWirePro :USD/JPY bulls loosen their grip a bit, dips to be bought
  NZDJPY Extremely Bullish Above 94: Broad NZD Buying Fuels Fresh Upside – Buy Dips at 93.70 Targeting 95


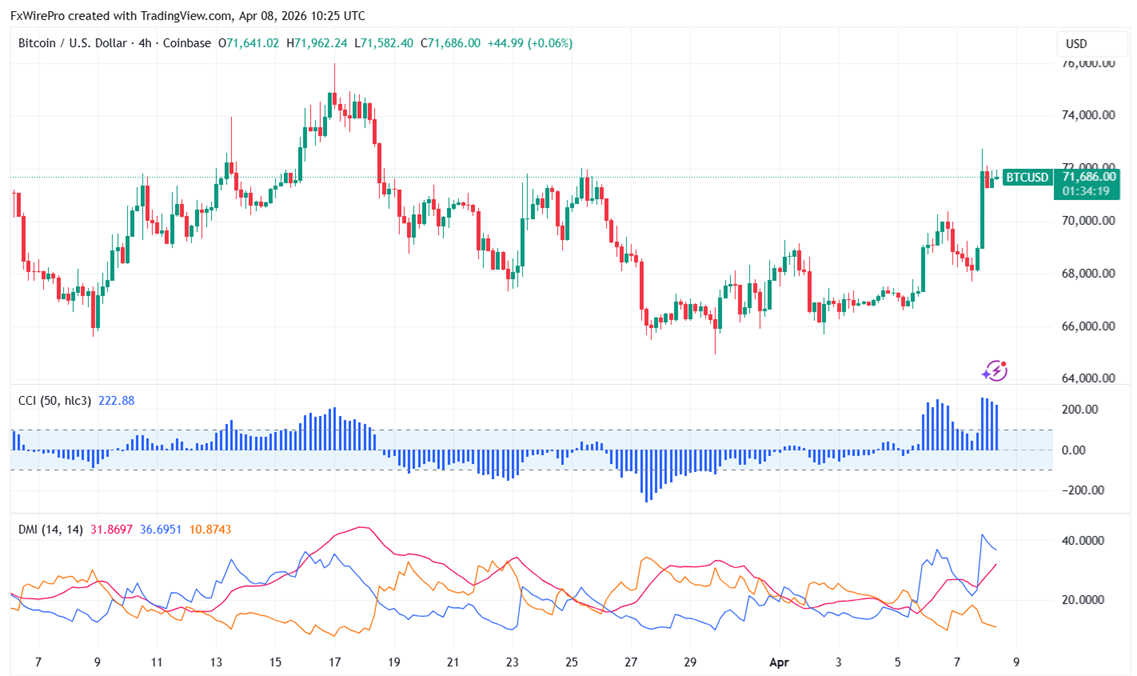
Following a 14-day truce pact between the United States and Iran, BTCUSD surged dramatically. Yesterday, it reached $72753 and is now trading around $71628.
|
Technicals |
CMP -$71652 |
Trend |
|
|
4- Hour chart |
Value |
|
|
|
55 EMA |
$68400 |
CMP> 55 EMA |
Bullish |
|
200- EMA |
$69153 |
CMP >200- EMA |
Bullish |
|
365- EMA |
$71438 |
CMP >365 EMA |
Bullish |
Major support- $64000/$60000/$52500/$50000. Minor bullishness only above $72500. Any break above targets $74500/$76200/$80000/$85500.
|
Momentum indicator (4-hour chart) |
Inference |
Value |
|
CCI(50) |
Bullish |
236 |
|
ADX |
Bullish |
Strength increased from 26 to 31 |
It is good to buy on dips around $70000 with SL around $67000 for a TP of $80000.


