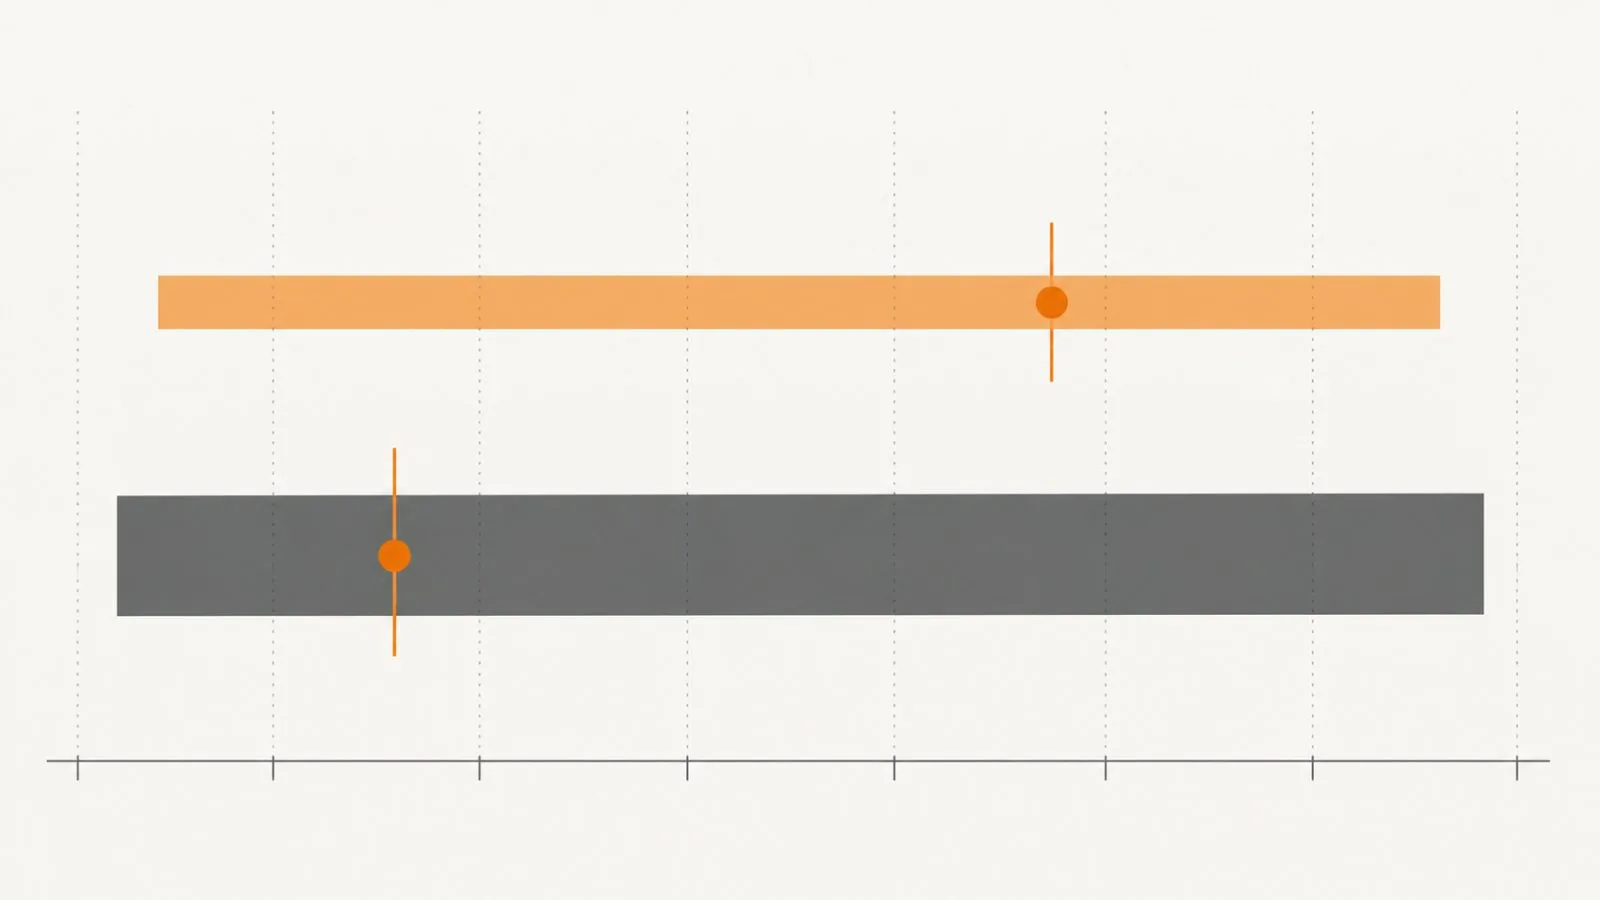
At 4:16 a.m. ET Monday, Bitcoin (BTC) stood at $79,612, down 1.15% over 24 hours as of 08:16 UTC; charts put leveraged-position exposure near $79,000 and $82,000.
Across a three-day window, one concentration fell between $78,500 and $79,000, with another at $81,500-$82,000. A weeklong view indicated possible short liquidations above $81,000. If Bitcoin rises into that area, closing short positions may involve purchases and add to market demand. The charts offer no indication of how prices might move between the zones or whether a turn would follow.
Ali Charts placed a resistance marker at $82,000 on its four-hour chart. That Martini Guy set $81,000 as a recovery threshold and pointed to lower liquidity if BTC moved below $79,000.
A prior EconoTimes report tracked Bitcoin liquidation exposure below support and above $85,000.