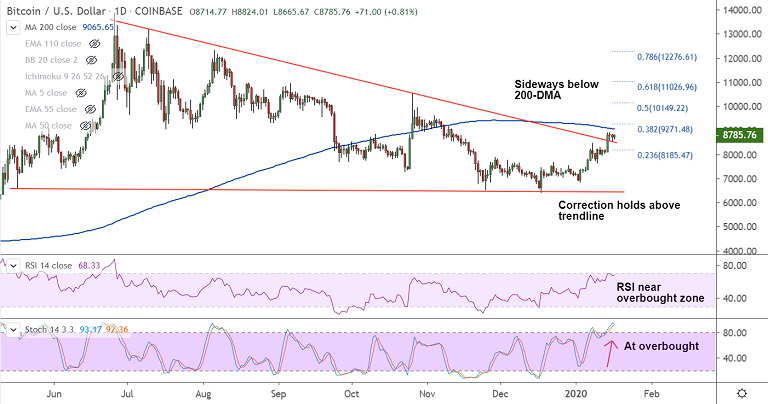
BTC/USD chart - Trading View
Exchange - Coinbase
Technical Analysis: Bias Bullish
GMMA Indicator: Major Trend - Turning slightly bullish; Minor Trend - Bullish
Overbought/ Oversold Index: Overbought
Volatility: High (Bollinger Bands widening)
Support: 8643 (5-DMA); Resistance: 9065 (200-DMA)
BTC/USD is extending sideways grind for the 3rd consecutive session, price capped below 200-DMA.
The pair was trading 0.69% higher at 8773 at around 04:15 GMT, after closing 1.07% lower in the previous session.
Price action has paused upside shy of 200-DMA, correction on account of overbought oscillators likely to be shallow.
Technical studies continue to show bullish bias. Correction has held above 200H MA. Pair finds strong support at 8000 levels.
Close above 20W MA for the week and break above 200-DMA (9065) will see bullish continuation.
Scope then for test of 11026 (61.8% Fib). Breach below 8000 could change near-term dynamics.