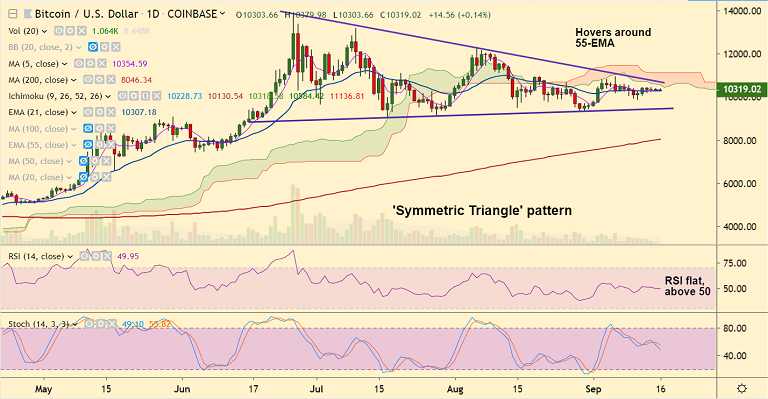
BTC/USD chart - Trading View
Exchange - Coinbase
Support: 9765 (38.2% Fib); Resistance: 10486 (50-DMA)
Technical Analysis: Bias Neutral
BTC/USD is extending sideways grind with no clear directional bias.
The pair has been trading in a 'Symmetric Triangle' pattern, breakout will provide clear direction.
Major trend has gone flat and price shows range trade around 55-EMA.
'Hammer' formation on the weekly chart raises scope for upside. Stochastics on weekly charts are at oversold.
Breakout of 'Symmetric Triangle' pattern with support from other indicators will be awaited for further direction.
Major resistance lies at 61.8% Fib at 11174, while 200-DMA is major support at 8046.



FxWirePro: USD/CAD bulls continue to hold the higher ground
ETH Cracks $2,100 in Bitcoin’s Wake as Bearish EMA Stack Deepens; Sellers Target $1,900 on Rallies
FxWirePro: USD/ZAR sell bias remains below key resistance zone
EUR/JPY Bulls Hold the Line Above 185: Eyes Locked on 188 Breakout
USD/CHF Smashes Higher to 0.7899 on Dollar Dominance—Bulls Bet on 0.7865 Dips for 0.8000 Breakout
Ethereum Tumbles Below $2K: Bears Eye $1,700 as All Key EMAs Flip Red
FxWirePro: USD/CNY bears maintain upper hand
FxWirePro- Major Pair levels and bias summary
Bitcoin Buckles at $73,500: Middle East Tensions and Weak Institutional Demand Set Bearish EMA Stack on $70K Collision Course
FxWirePro: GBP/USD recovers some ground but bears are not done yet 


