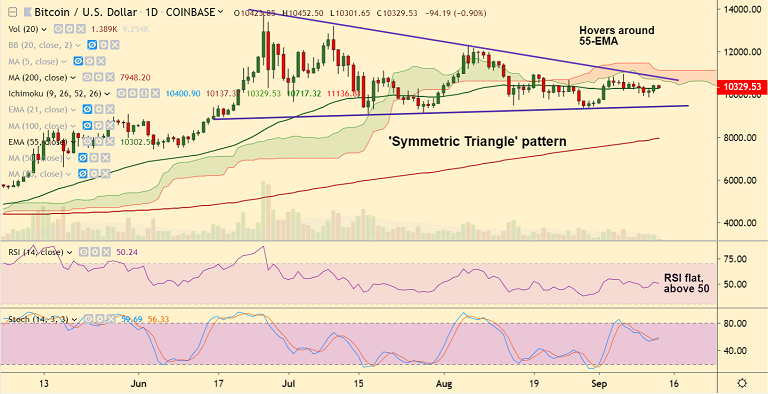
BTC/USD chart - Trading View
Exchange - Coinbase
Support: 10305 (55-EMA); Resistance: 10717 (Cloud base)
Technical Analysis: Bias Slightly Bullish
BTC/USD has retraced above 55-EMA and is consolidating break above 200H SMA.
The pair is extending sideways in a 'Symmetric Triangle' pattern with no clear directional bias.
Major trend has gone flat and price shows choppy trade around 55-EMA. 'Hammer' formation on the weekly chart raises scope for upside.
Breakout of 'Symmetric Triangle' pattern with support from other indicators will be awaited for clear directional bias.
Major resistance lies at 61.8% Fib at 11174, while 200-DMA is major support at 7948.