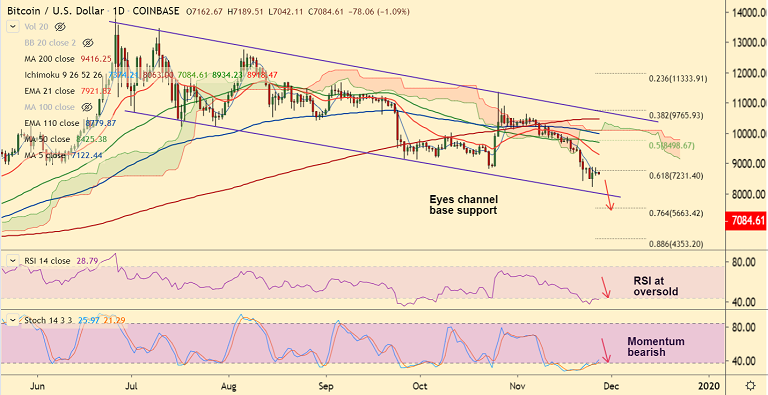
BTC/USD chart - Trading View
Exchange - Coinbase
Support: 6600 (May 17 low); Resistance: 7222 (110H EMA)
Technical Analysis: Bias Bearish
BTC/USD was trading 1.45% lower at 7059 at 06:10 GMT, after closing 0.50% lower in the previous session.
The pair's recovery attempts have faltered at 110H EMA (currently at 7219).
Price action has failed to close above 110H EMA and major trend still remains bearish.
The pair has formed a 'Doji' at highs suggesting hesitation among traders to support prices higher.
Stochs, RSI and 5-DMA are still biased lower and MACD and ADX support further weakness in the pair.
Downside resumption will see test of channel base support at 6240. Break below will open downside.
On the flipside, break above 200H SMA at 7474 will see scope for further upside. Gains till 21-EMA at 7921 then likely.