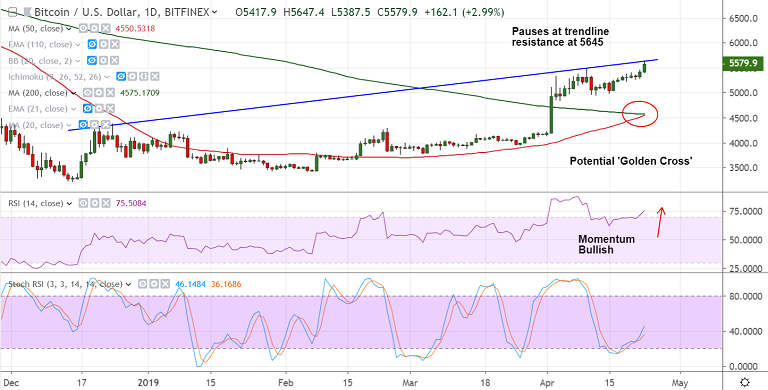
BTC/USD chart - Trading View
Exchange - Bitfinex
Support: 5396 (5-DMA); Resistance: 5645 (trendline)
Technical Analysis: Bias Bullish
- BTC/USD spikes to hit new 2019 highs at 5647
- The pair has paused at stiff trendline resistance at 5645
- Momentum with the bulls, potential 'Golden Cross' keeps scope for upside
- Price action is above major moving averages and daily cloud
- Volatility is rising as evidenced by widening Bollinger bands
- Break above trendline resistance at 5645 and confirmation on the 'Golden Cross' opens upside
- Scope for test of 61.8% Fib at 6041. Bullish invalidation below 200-DMA.
For details on FxWirePro's Currency Strength Index, visit http://www.fxwirepro.com/currencyindex.


FxWirePro: GBP/USD recovers some ground but bears are not done yet
FxWirePro: USD/ZAR slips as SARB delivers surprise rate hike
FxWirePro: USD/CAD slips as Canadian dollar firms on hopes for US-Iran ceasefire deal
Ether Breaks Below $2,100: Triple EMA “Sell-the-Rally” Setup Targets $1,900
Aussie Yen Breaks 114 Barrier: Bulls Lock Horns With Resistance, Eyes on 115 Summit
FxWirePro: USD/ZAR sell bias remains below key resistance zone
FxWirePro: GBP/NZD slide extends ,eyes 2.2600 level
FxWirePro- Major Crypto levels and bias summary
Ethereum Tumbles Below $2K: Bears Eye $1,700 as All Key EMAs Flip Red
NZD/JPY Breakout Blast: Kiwi Rocket Smashes 94.50 Resistance, Bulls Lock Sights on 95