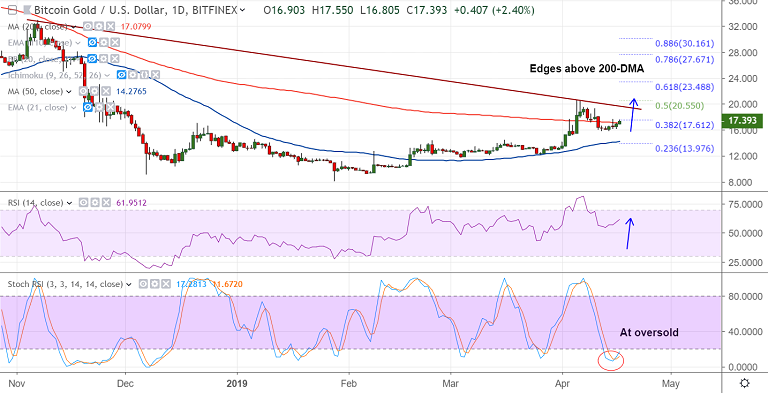
- BTG/USD has managed to retrace above 200-DMA
- Price has held support at 21-EMA (currently at 16.15), weakness likely on break below
- Technical indicators support further upside in the pair
- GMMA has shown a shift in trend with shorter term averages edging above the longer term averages
- Stochastics RSI indicator is at oversold levels, we see some bounce in the pair
- Break above 38.2% Fib (17.612) will take the pair to 19.50 (trendline resistance)
- 5-DMA at 16.70 is immediate support. Break below 21-EMA will see drag till 110-EMA at 14.82
Hyperliquid founder Jeff Yan is calling for a regulatory framework in the United States that would place compliance responsibilities on financial companies using the blockchain rather than regulating the underlying netwo…
Bitcoin (BTC) dropped more than 2% over the past 24 hours, trading near $80,948 as a widespread selloff across global financial markets pushed investors away from riskier assets. Major cryptocurrencies, including Ethereu…