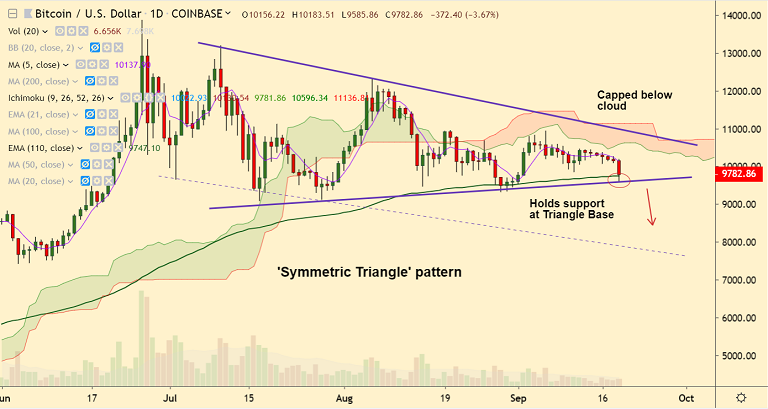
BTC/USD chart - Trading View
Exchange - Coinbase
Support: 9071 (July 17 low); Resistance: 10,138 (5-DMA)
Technical Analysis: Bias Bearish
BTC/USD saw a sudden slump in the previous hour, slips below the $10,000 mark.
The pair, after extending sideways above $10,000 over the last few days, has turned bearish.
ADX is rising with negative DMI dominance, supporting more downside in the pair.
Stochs and RSI and biased lower and RSI has slipped below 50 mark showing strength in the downside.
Price action has dipped below 110-EMA (9747) and 38.2% Fib (9765) supports.
The pair trades in a 'Symmetric Triangle' pattern and breach at triangle base support (9585) will drag the price lower.
Volatility however, is low and close below 110-EMA is required for downside continuation.
Next major support lies at 9071 (July 17 low), while 5-DMA is immediate resistance at 10,138.