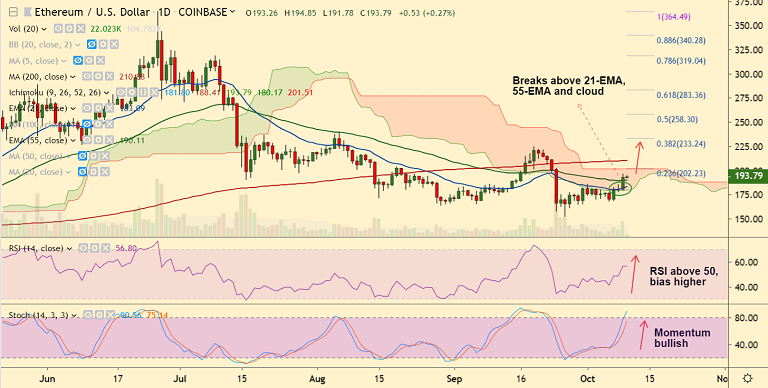
ETH/USD chart - Trading View
Exchange - Coinbase
Support: 190.13 (55-EMA); Resistance: 199.82 (110-EMA)
Technical Analysis: Bias Bullish
ETH/USD is consolidating previous session's gains, bias bullish.
The pair is trading marginally higher at 194.24, up 0.51% at 04:50 GMT.
Price action has broken above 21-EMA and daily cloud base, scope for further upside.
Momentum studies on the daily charts are bullish. RSI is above 50 and bias higher.
Bullish 5-DMA crossover on 20-DMA and bullish MACD line crossover on signal line supports further gains.
Next bull target lies at 110-EMA at 199.82 ahead of 23.6% Fib at 202.23.
55-EMA is immediate support at 190.10, break below could see dip till 50-DMA at 183.82.