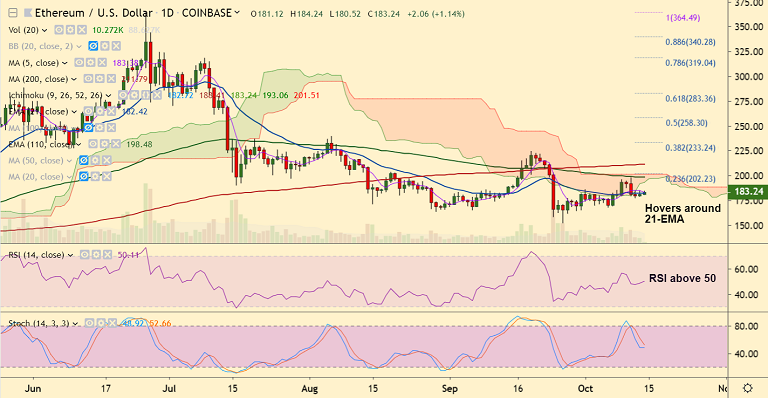
ETH/USD chart - Trading View
Exchange - Coinbase
Support: 178.70 (2H 200 SMA); Resistance: 198.48 (110-EMA)
Technical Analysis: Bias turning bullish (intraday)
ETH/USD trades marginally higher on the day at 183.36 at 08:30 GMT.
The pair is consolidating above 200H SMA and bias on the intraday charts is turning slightly bullish.
Downticks in the pair have held above 2H 200 SMA (178.70) and we see weakness only on break below.
RSI is holding above 50 mark and 'Bullish Divergence' on RSI and Stochs to support upside.
5-DMA is immediate resistance at 183.37, decisive break above to see further upside.
Next major hurdle lies at 110-EMA at 198.48 ahead of 23.6% Fib at 202.23.
On the flipside, 2H 200 SMA (178.70) is strong support, break below eyes 164.99 (Sept 6 low).



Aussie Yen Breaks 114 Barrier: Bulls Lock Horns With Resistance, Eyes on 115 Summit
FxWirePro: GBP/NZD extends decline , vulnerable to more downside
FxWirePro: USD/ZAR sell bias remains below key resistance zone
FxWirePro- Major Pair levels and bias summary
FxWirePro: NZD/USD gains as hawkish RBNZ comments boost Kiwi dollar
FxWirePro- Major Crypto levels and bias summary
NZD/JPY Breakout Blast: Kiwi Rocket Smashes 94.50 Resistance, Bulls Lock Sights on 95
FxWirePro: USD/CAD slips as Canadian dollar firms on hopes for US-Iran ceasefire deal
FxWirePro- Major Crypto levels and bias summary
FxWirePro: GBP/USD edged higher as hopes for US-Iran deal boost riskier assets
FxWirePro- Major Crypto levels and bias summary
Ethereum Cracks Below $2,000 as Bitcoin Contagion Bites—Bearish EMA Stack Sets Sights on $1,700 


