ETH/USD chart - Trading View
Exchange - Coinbase
Technical Analysis: Bias Bullish
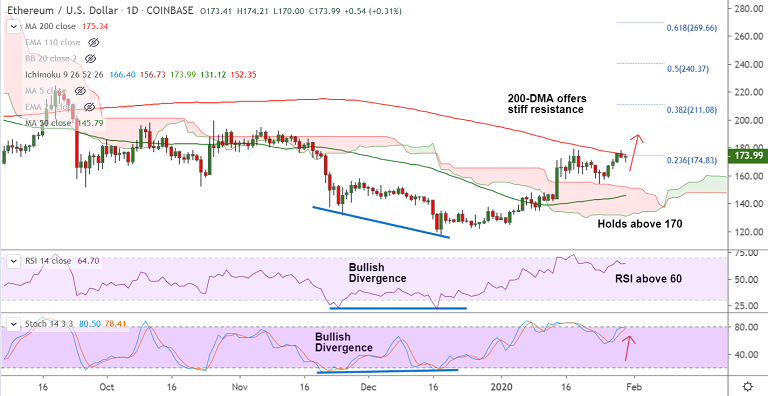
Support: 166.49 (200H MA); Resistance: 175.34 (200-DMA)
ETH/USD was trading 0.31% higher on the day at 173.99 at around 04:57 GMT.
The pair has erased losses on the day and has edged higher from session lows at 170.00.
Technical indicators are strongly bullish, price action is extending break above 21W EMA (166.56).
Major and minor trend as evidenced by the GMMA indicator are bullish and breakout at 200-DMA will propel the pair higher.
Major hurdles on the upside align at 55W EMA at 196.93 ahead of 110W EMA at 208.91 and 38.2% Fib at 211.08.
200H MA is immediate support at 166.49. Rejection at 200-DMA and break below 21-EMA (162.78) will see near-term weakness.