


 JPY Major Currency Score: USD/JPY Bullish, Other Pairs Neutral
  AUD/JPY Stays Above 110 as Weak Yen Fuels a Potential Move Toward 112
  FxWirePro- Major Crypto levels and bias summary
  Stellar Overtakes Ethereum in RWA Fund Inflows as XRP Leads Commodities
  FxWirePro- Woodies Pivot
  EUR/USD Bearish Rebound: Selling the Rallies Near Trendline Resistance
  BNB Price Faces Pressure as DOJ Investigates Binance
  FxWirePro: USD/CAD climbs to 18-month peak after sharp Canadian employment decline
  Bitcoin Rebounds to $82K as Trump Eases Iran War Fears
  XRP Holds Steady at $1.39 as Crypto Market Faces Heavy Liquidations
  FxWirePro: GBP/AUD eases slightly but trend is still bullish
  XRP Price Eyes $1.50 as ETFs Attract $8.17M Inflows
  Solana Whale Moves $51M in SOL to Coinbase Amid Price Drop
  FxWirePro: EUR/AUD gains some ground but outlook is bearish
  GRAM Price Jumps 9% as Telegram Expands Money Wallet
  FxWirePro: EUR/NZD uptrend looks tired, but continues to hold
  Ledger Investigates Alleged $86 Million Crypto Wallet Theft


, breakout eyes 110-EMA at 157.80 - EconoTimes)


 Add as a preferred source on Google
ETH/USD chart - Trading View
Exchange - Coinbase
Technical Analysis: Bias Bullish
GMMA Indicator: Major Trend - Neutral; Minor Trend - Slightly bullish
Overbought/ Oversold Index: Overbought
Volatility: High and Rising
Support: 144.48 (55-EMA); Resistance: 155.43 (Cloud top)
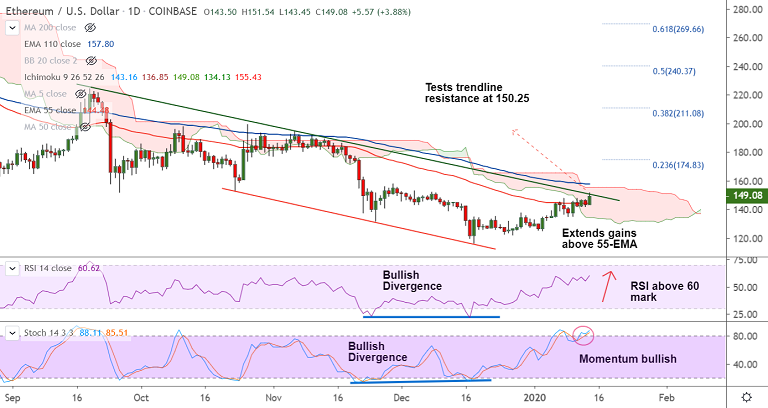
ETH/USD was trading 3.99% higher on the day at 149.24 at 05:15 GMT, after closing 2.11% lower in the previous session.
The pair is extending break above 55-EMA and intraday bias has turned bullish.
Price action is testing major trendline resistance at 150.25 and decisive break above will propel the pair higher.
Volatility is rising, MACD supports upside. Positive DMI dominance added with rising ADX adds to the bullish bias.
Bullish divergence on RSI and Stochs along with strong bullish momentum supports further gains.
GMMA shows short-term MAs are on verge of break above long-term MAs, which if completed will boost further gains.
Breakout at trendline resistance finds next hurdle at cloud top at 155.43 ahead of 110-EMA at 157.81. Bullish continuation on break above.







