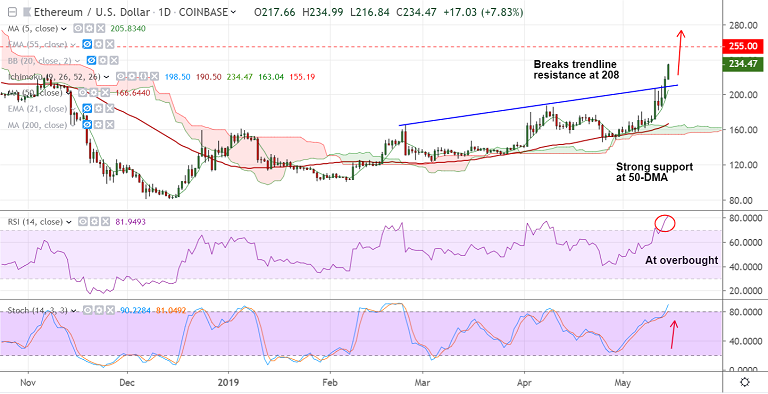
ETH/USD chart - Trading View
Exchange - Coinbase
Support: 239.30 (55W EMA); Resistance: 204.98 (5-DMA)
Technical Analysis: Bias Bullish
ETH/USD is riding the bull wave, hits 8-month highs at 234.99
The pair has broken above trendline resistance at 208, bias bullish
Stochs and RSI are sharply higher and MACD and DMI support gains
That said, oscillators are at overbought levels which could see some correction from highs
55W EMA at 239 offers strong resistance, breakout above required for further upside
5-DMA at 205.83 is immediate support below trendline, break below to see dip till 50-DMA
For details on FxWirePro's Currency Strength Index, visit http://www.fxwirepro.com/currencyindex.



FxWirePro: USD/CNY bears maintain upper hand
Bitcoin Cracks $75K as $1.3B ETF Exodus and Middle East Jitters Spook Bulls; Bears Eye $70K
FxWirePro- Major Crypto levels and bias summary
FxWirePro: GBP/AUD downside pressure builds, key support level in focus
FxWirePro- Major Crypto levels and bias summary
FxWirePro: USD/JPY edges higher but bulls lack punch
FxWirePro: USD/CAD bulls continue to hold the higher ground
FxWirePro: GBP/USD edged higher as hopes for US-Iran deal boost riskier assets
Bitcoin Buckles at $73,500: Middle East Tensions and Weak Institutional Demand Set Bearish EMA Stack on $70K Collision Course
Pound-Yen Roars Back Above 214: Bulls Reload for 216–217 Charge on Dip-Buying Setup
FxWirePro: USD/ZAR sell bias remains below key resistance zone 


