


 FxWirePro: GBP/NZD downtrend loses steam, remains on bearish path
  FxWirePro: AUD/USD better risk puts bulls back in charge
  FxWirePro: GBP/AUD dips amid heightened Geopolitical concerns
  FxWirePro: EUR/ AUD dips below 1.6300 level, focus on near term support
  FxWirePro- Woodies pivot (Major)
  FxWirePro :USD/JPY drifts above 162 as range trading persists
  FxWirePro: NZD/USD rallies as NZ inflation hits 2-1/2-year high
  BTCUSD Holds Above 365 EMA as Bullish Momentum Builds Toward $70K


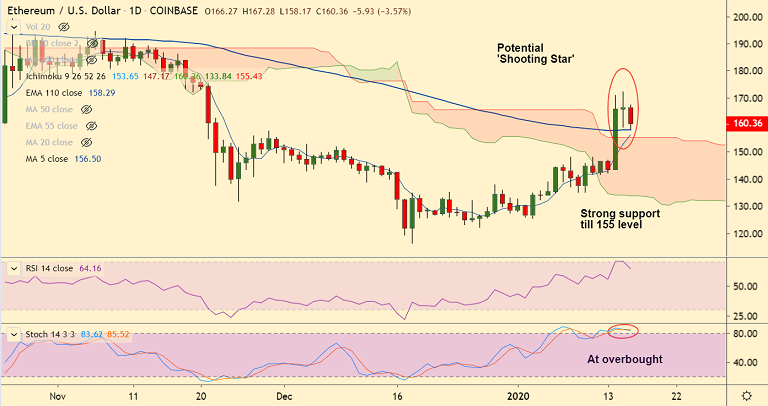
ETH/USD chart - Trading View
Exchange - Coinbase
Technical Analysis: Bias Bullish
GMMA Indicator: Major Trend - Neutral; Minor Trend - Bullish
Overbought/ Oversold Index: Overbought
Volatility: High
Support: 158.28 (110-EMA); Resistance: 174.83 (23.6% Fib)
ETH/USD was trading 3.87% lower on the day at 159.82 at around 04:25 GMT, slightly higher from session lows at 158.17.
The pair is on track for a potential 'Shooting Star' formation on the daily charts, after closing with a Doji formation in the previous session.
That said, technical studies do not support weakness for now, though, overbought oscillators could cause minor pullbacks.
The pair finds series of strong support till 155 level - 110-EMA at 158.28, 5-DMA at 156.49 and cloud top at 155.43.
Breach below cloud top support could see drag till 200H MA at 146.68. Violation there could change near-term dynamics.
On the other side, 23.6% Fib is immediate resistance at 174.83. Break above 200-DMA (183.53) confirms bullish continuation.


