ETH/USD chart - Trading View
Exchange - Coinbase
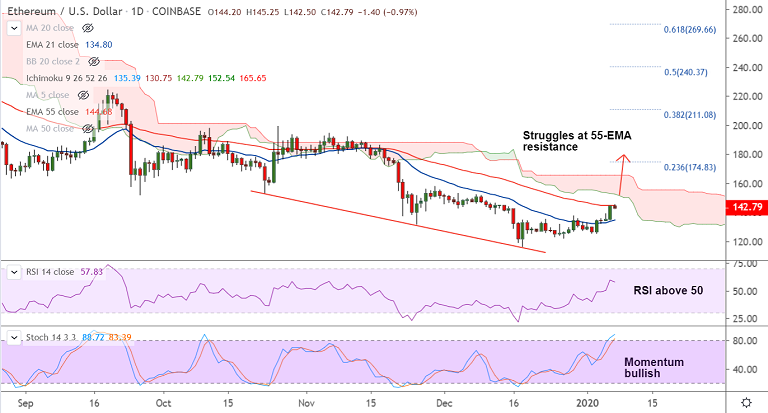
Support: 138.12 (5-DMA); Resistance: 144.68 (55-EMA)
Technical Analysis: Bias Bullish
ETH/USD was consolidating previous session's gains, bias remains bullish.
The pair was trading marginally lower at 142.70, down 1.03% at 04:45 GMT, after closing 6.56% higher in the previous session.
Price action struggles at 55-EMA resistance at 144.68, break above will propel prices higher.
Technical indicators have turned bullish. Stochs and RSI are biased higher. Volatility is also rising.
On the weekly charts the pair has resumed upside after 'Hammer' and back-to-back 'Dragonfly Doji' formations.
Break above 55-EMA will find next major hurdle at daily cloud (152.54). Breakout above cloud will shift major bias to bullish.


NZD/JPY Breakout Blast: Kiwi Rocket Smashes 94.50 Resistance, Bulls Lock Sights on 95
Bitcoin Buckles at $73,500: Middle East Tensions and Weak Institutional Demand Set Bearish EMA Stack on $70K Collision Course
FxWirePro- Major Crypto levels and bias summary
ETH Cracks $2,100 in Bitcoin’s Wake as Bearish EMA Stack Deepens; Sellers Target $1,900 on Rallies
FxWirePro: GBP/NZD slide extends ,eyes 2.2600 level
USD/CHF Smashes Higher to 0.7899 on Dollar Dominance—Bulls Bet on 0.7865 Dips for 0.8000 Breakout
Ethereum Tumbles Below $2K: Bears Eye $1,700 as All Key EMAs Flip Red
FxWirePro: USD/ZAR sell bias remains below key resistance zone
FxWirePro: GBP/AUD downside pressure builds, key support level in focus
FxWirePro: EUR/AUD downward momentum remains in place
FxWirePro- Major Crypto levels and bias summary 


