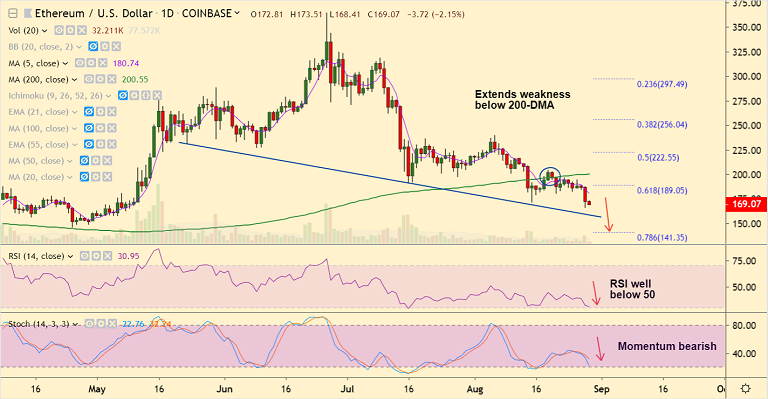
ETH/USD chart - Trading View
Exchange - Coinbase
Support: 158 (Trendline); Resistance: 180.76 (5-DMA)
Technical Analysis: Bias Bearish
Ethereum resumes weakness below 200-DMA, eyes trendline support at 158 level.
The pair was trading 2.22% lower on the day at 168.75 at 07:15 GMT.
Technical studies are bearish. RSI well below 50 and momentum highly bearish.
MACD below zero, volatility is high and ADX is rising in support of the downtrend.
The pair is on track to test trendline support at 158 level. Retrace above 200-DMA (200.55) negates bearish bias.



FxWirePro- Major Crypto levels and bias summary
Ethereum Tumbles Below $2K: Bears Eye $1,700 as All Key EMAs Flip Red
FxWirePro: NZD/USD gains as hawkish RBNZ comments boost Kiwi dollar
FxWirePro: USD/CNY bears maintain upper hand
Bitcoin Cracks $75K as $1.3B ETF Exodus and Middle East Jitters Spook Bulls; Bears Eye $70K
Ethereum Cracks Below $2,000 as Bitcoin Contagion Bites—Bearish EMA Stack Sets Sights on $1,700
FxWirePro: GBP/AUD downside pressure builds, key support level in focus
Bitcoin Buckles at $73,500: Middle East Tensions and Weak Institutional Demand Set Bearish EMA Stack on $70K Collision Course
FxWirePro: USD/ZAR sell bias remains below key resistance zone
FxWirePro: GBP/NZD extends decline , vulnerable to more downside 


