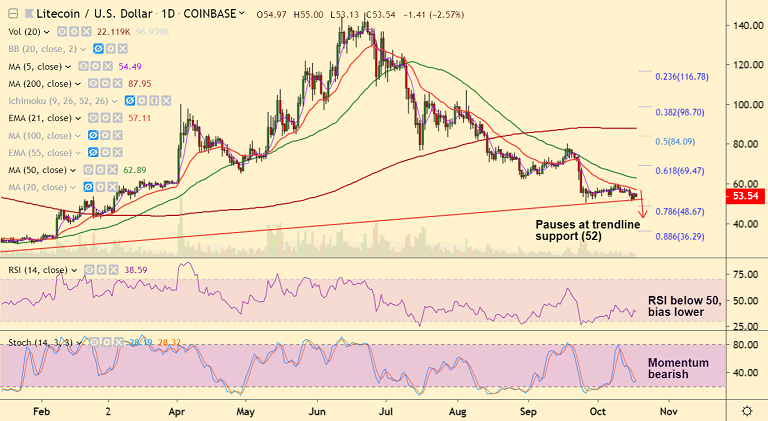
LTC/USD chart - Trading View
Exchange - Coinbase
Support: 52 (trendline); Resistance: 57.19 (21-EMA)
Technical Analysis: Bias Bearish
LTC/USD was trading marginally lower on the day at 54.39 at 05:20 GMT.
The pair is struggling to extend previous session's gains, bias remains bearish.
Bullish divergence keeps scope for upside, but breakout above 21-EMA required for gains.
GMMA indicators shows bearish trend for both near and long term.
The pair currently finds strong support at rising trendline at 52 mark. Break below will see further downside.
Next immediate support lies at 78.6% Fib at 48.67 ahead of 42.40 (Feb 27 low).
Break above 21-EMA could see gains till 50-DMA at 62.90.