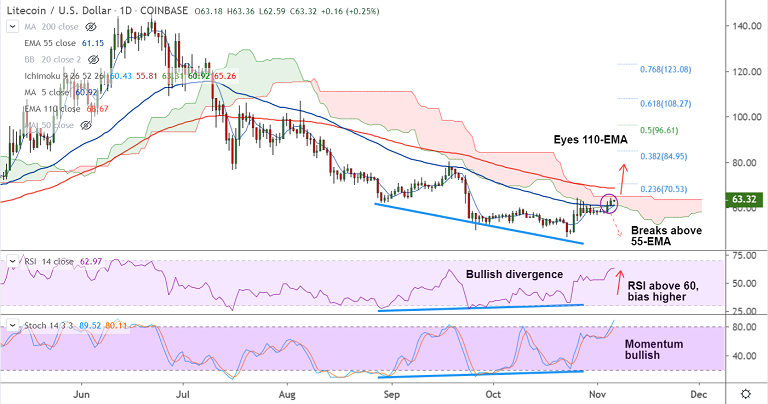
LTC/USD chart - Trading View
Exchange - Coinbase
Support: 61.16 (55-EMA); Resistance: 68.67 (110-EMA)
Technical Analysis: Bias bullish
LTC/USD is extending 55-EMA break, edges higher for the 3rd straight session.
The pair was trading at 63.59, up 0.68% at 05:30 GMT after closing 2.85% higher on Monday's trade.
Technical indicators have turned bullish. Volatility is rising. 'Bullish Divergence' supports bullish bias.
Immediate hurdle aligns at cloud top at 65.26. Break above cloud will see test of 110-EMA at 68.6 ahead of 23.6% Fib at 70.53.
55-EMA is now major support at 61.16. Failure to hold above will see downside resumption.