
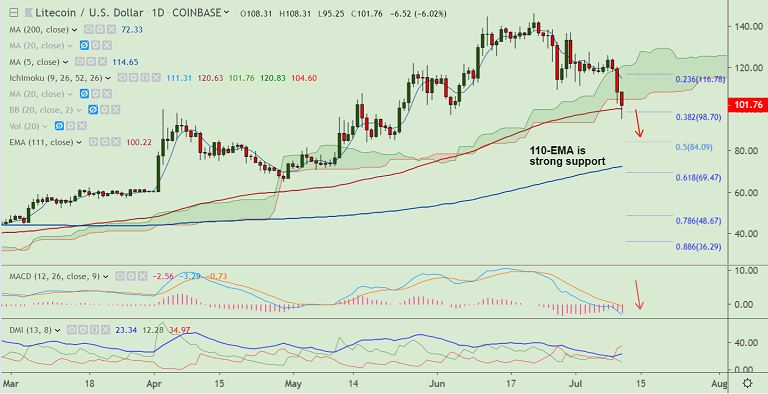
LTC/USD chart - Trading View
Exchange - Coinbase
Support: 84 (May 17 low); Resistance: 115 (55-EMA)
Technical Analysis: Bias Bearish
LTC/USD is extending weakness for the 4th straight week, bias is bearish.
The pair hit 7-week lows at 95.25 before paring some losses to trade at 102.30 at 06:00 GMT.
Price action has retraced dip below 110-EMA support (100.46), close below will see further downside.
Technical analysis points to further weakness for the pair. Price action has dipped below daily cloud.
MACD supports weakness and ADX is rising with negative DMI dominance.
Stochs and RSI are sharply lower and volatility is rising as evidenced by widening Bollinger Bands.
Decisive break below 110-EMA (100.46) will take the pair lower, test of 84 (May 17 low) likely.
For details on FxWirePro's Currency Strength Index, visit http://www.fxwirepro.com/currencyindex.


