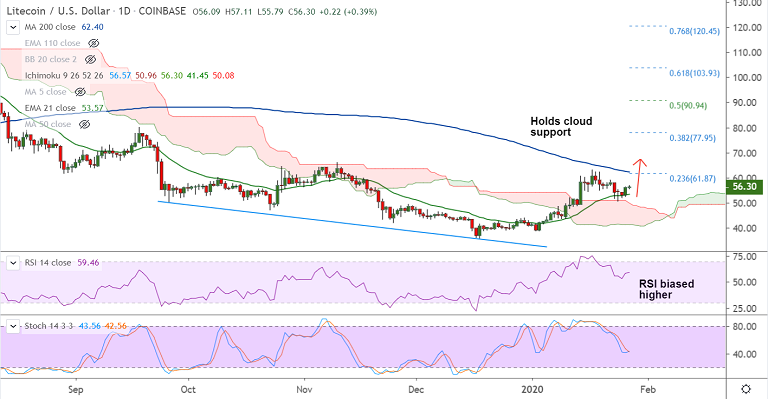
LTC/USD chart - Trading View
Exchange - Coinbase
Technical Analysis: Bias Neutral
GMMA Indicator: Major Trend - Bullish; Minor Trend - Turning slightly bullish
Overbought/ Oversold Index: Neutral
Volatility: High
Support: 54.88 (5-DMA); Resistance: 62.40 (200-DMA)
LTC/USD was trading largely muted on the day at 56.34 at around 09:35 GMT.
The pair is struggling to extend previous session's rally, finds stiff resistance at 55W EMA at 56.74.
Price action has bounced off daily cloud support and has retraced above 200H MA.
Major and minor trend as evidenced by GMMA indicator are biased higher. Scope for upside.
The pair finds strong resistance at 21W EMA at 56.72. Break above will see gains till 200-DMA at 62.40.
200-DMA breakout will support a sustained upside.Next bull target aligns at 38.2% Fib at 77.95.
21-EMA is strong support at 53.55. Break below negates near-term upside bias.