LTC/USD chart - Trading View
Exchange - Coinbase
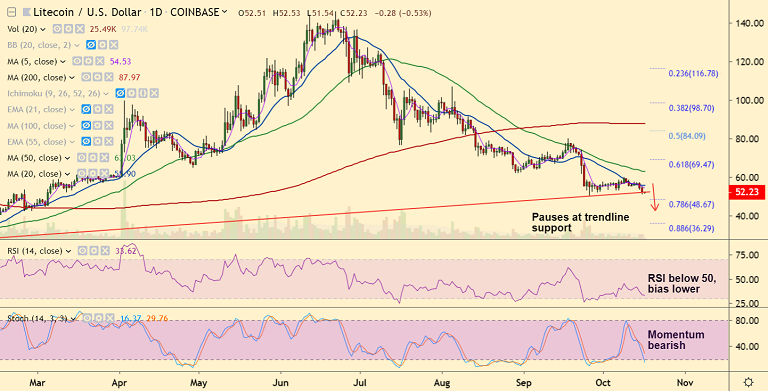
Support: 48.67 (78.6% Fib); Resistance: 57.22 (21-EMA)
Technical Analysis: Bias Bearish
LTC/USD has paused downside at strong trendline support (52).
Technical studies support further weakness, break below trendline support will see downside resumption.
Stochs and RSI are sharply lower, volatility is rising as shown by expanding Bollinger bands.
MACD is well in the negative territory and ADX is rising in support of downside.
Next major support aligns at 78.6% Fib at 48.67 ahead of 42.40 (Feb 27 low).
5-DMA is immediate resistance at 54.53. Break above 50-DMA required for further upside.



Bitcoin Bleeds $704M in ETF Outflows as Institutional Exodus Accelerates
FxWirePro: GBP/USD edged higher as hopes for US-Iran deal boost riskier assets
EUR/JPY Bulls Hold the Line Above 185: Eyes Locked on 188 Breakout
Ethereum Tumbles Below $2K: Bears Eye $1,700 as All Key EMAs Flip Red
FxWirePro: NZD/USD gains as hawkish RBNZ comments boost Kiwi dollar
USD/CHF Smashes Higher to 0.7899 on Dollar Dominance—Bulls Bet on 0.7865 Dips for 0.8000 Breakout
Ether Breaks Below $2,100: Triple EMA “Sell-the-Rally” Setup Targets $1,900
NZD/JPY Breakout Blast: Kiwi Rocket Smashes 94.50 Resistance, Bulls Lock Sights on 95
FxWirePro- Woodies pivot (Major)
FxWirePro- Major Crypto levels and bias summary
FxWirePro- Major Crypto levels and bias summary 


