
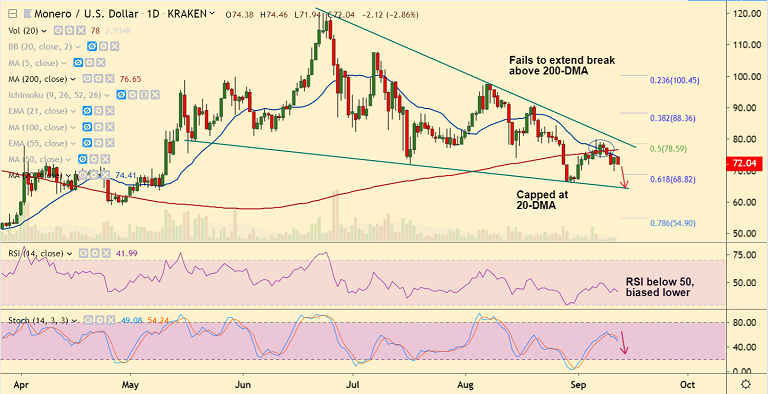
XMR/USD chart - Trading View
Exchange - Kraken
Support: 68.82 (61.8% Fib); Resistance: 74.41 (20-DMA)
Technical Analysis: Bias Bearish
XMR/USD was trading 2.78% lower on the day at 72.10 at 04:00 GMT, bias is bearish.
The pair has resumed weakness after a brief pause on Wednesday's trade.
Price action edges lower in 'Sloping Triangle' pattern and technical indicators support downside.
Stochs have turned lower and RSI is well below 50 mark and biased lower. Stochastics RSI is showing a rollover from overbought levels.
Recovery attempts struggled to hold above 200-DMA, raising scope for further weakness.
Immediate support lies at 61.8% Fib retracement at 68.82. Break below will see test of trendline support at 67.85.


