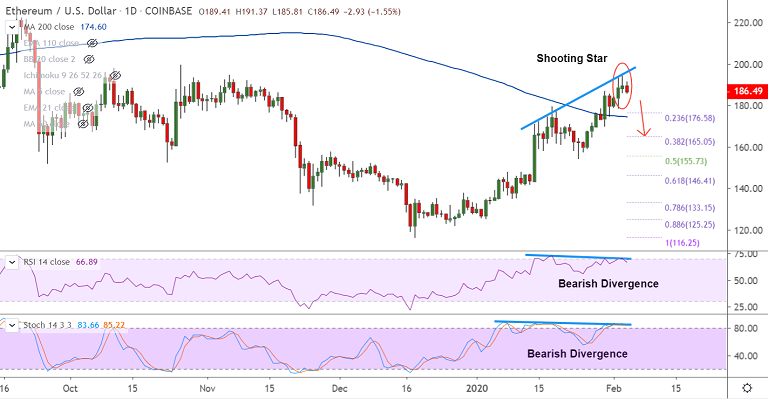
ETH/USD chart - Trading View
Exchange - Coinbase
Technical Analysis: Bias Neutral to slightly bearish
Support: 179.34 (200H MA); Resistance: 197.07 (55W EMA)
ETH/USD was trading 1.18% lower on the day at 187.18 at around 05:15 GMT, after closing 0.60% higher in the previous session.
The pair looks set to retrace some of the recent gains, 200H MA at 179.34 looks to be the immediate bear target.
'Shooting Star' pattern on the daily charts has dented scope for upside in the pair. Bearish Divergence on RSI and Stochs adds to the downside bias.
Further 55W EMA is major resistance at 197.06. Any meaningful upside only on break above.
Major trend as shown by the GMMA is bullish. Minor trend has gone flat. Retrace below 200-DMA will open downside for the pair.



FxWirePro: GBP/USD recovers some ground but bears are not done yet
FxWirePro- Major Crypto levels and bias summary
FxWirePro: USD/ZAR slips as SARB delivers surprise rate hike
FxWirePro- Major Pair levels and bias summary
FxWirePro: USD/CAD slips as Canadian dollar firms on hopes for US-Iran ceasefire deal
FxWirePro: GBP/NZD slide extends ,eyes 2.2600 level
Ethereum Tumbles Below $2K: Bears Eye $1,700 as All Key EMAs Flip Red
Bitcoin Buckles at $73,500: Middle East Tensions and Weak Institutional Demand Set Bearish EMA Stack on $70K Collision Course
USD/CHF Smashes Higher to 0.7899 on Dollar Dominance—Bulls Bet on 0.7865 Dips for 0.8000 Breakout
FxWirePro: GBP/NZD extends decline , vulnerable to more downside
FxWirePro: GBP/USD edged higher as hopes for US-Iran deal boost riskier assets 


