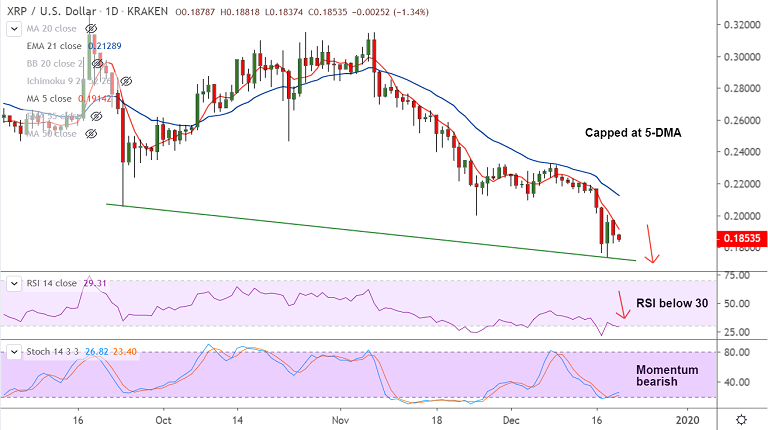
XRP/USD chart - Trading View
Exchange - Kraken
Support: 0.1725 (Trendline); Resistance: 0.1913 (5-DMA)
Technical Analysis: Bias Bearish
XRP/USD was trading 1.47% lower at 0.1851 at 08:10 GMT after closing 4.12% lower in the previous session.
Technical indicators show no signs of reversal yet. Bear grip remains intact, more downside on charts.
Recovery in the pair remains capped below 5-DMA and technical bias remains strongly bearish on the weekly charts.
Bearish MACD crossover and rising volatility set to plummet prices further. GMMA on daily and weekly charts suggests strong downtrend.
The pair finds major support at 0.1725 (Trendline). Break below will see further downside in the pair.
5-DMA is immediate resistance at 0.1914. Break above 21-EMA (0.2128) required for near-term trend reversal.