Home / Digital Currency / Article Digital Currency / Technicals
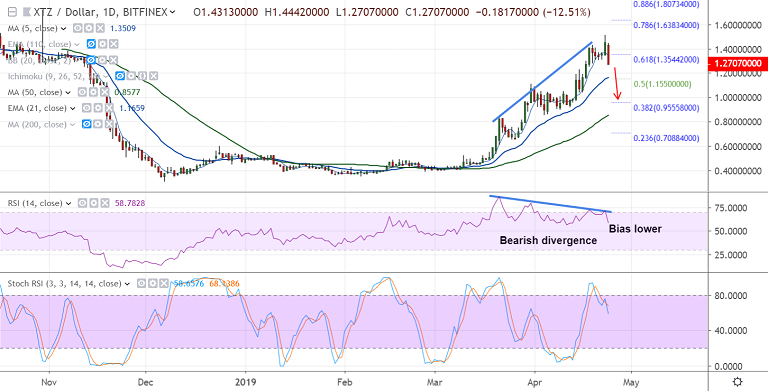
Add as a preferred source on Google Crypto Technicals: XTZ/USD retraces below 61.8% Fib, breaks 1H 200 SMA support, bias bearish XTZ/USD chart - Trading View Exchange - Bitfinex Support: 1.1659 (21-EMA); Resistance: 1.3544 (61.8% Fib) Technical Analysis: Bias turning bearish - Tezos exhibits volatile trade, slumps in tanden with BTC weakness - XTZ…
By FxWirePro Team Apr 24, 2019, 10:56 AM UTC
Image from the original EconoTimes article Read the original article
XTZ/USD chart - Trading View Exchange - Bitfinex Support : 1.1659 (21-EMA); Resistance : 1.3544 (61.8% Fib)Technical Analysis: Bias turning bearish For details on FxWirePro's Currency Strength Index, visit http://www.fxwirepro.com/currencyindex .
Digital Currency Coinglass measured Ether options open interest at $5.81 billion, up 0.1% from the previous day, with calls representing most of both open interest and trading volume.
Digital Currency The scheduled opening is 8 a.m. ET (12:00 UTC), with access through OKX’s web, app and API channels subject to regional availability.
Digital Currency Customers can select a crypto asset and wallet; AEON says it handles conversion and starts a local transfer. The company has not named merchants using the Chile feature.