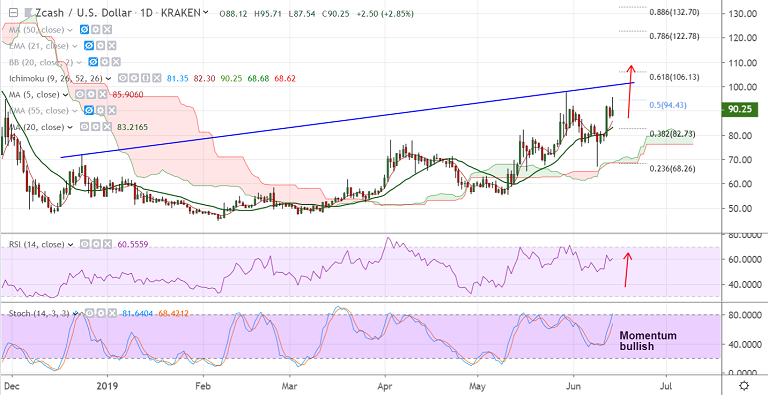
ZEC/USD chart - Trading View
Exchange - Kraken
Support: 86.21 (5-DMA); Resistance: 100.75 (trendline)
Technical Analysis: Bias Bullish
ZCash has hit new highs for the month at 95.71 before paring some gains to currently trade at 91.78.
Technical indicators suggest further upside for the pair. Scope for test of trendline resistance at 100.75.
Stochs and RSI are biased higher. Price action is above cloud and major moving averages.
The pair has retraced above 2H 200 SMA and retrace has held support at 50-DMA.
Further, 'Golden Cross' formation (Bullish 50-DMA crossover on 200-DMA) on the daily charts, supports bullish bias.
ZEC/USD eyes immediate resistance 100.75 (trendline). Break above will see test of 61.8% Fib at 106.13.
On the flipside, break below 21-EMA will see dip till 50-DMA (72.41). Bullish invalidation only below 200-DMA
For details on FxWirePro's Currency Strength Index, visit http://www.fxwirepro.com/currencyindex.