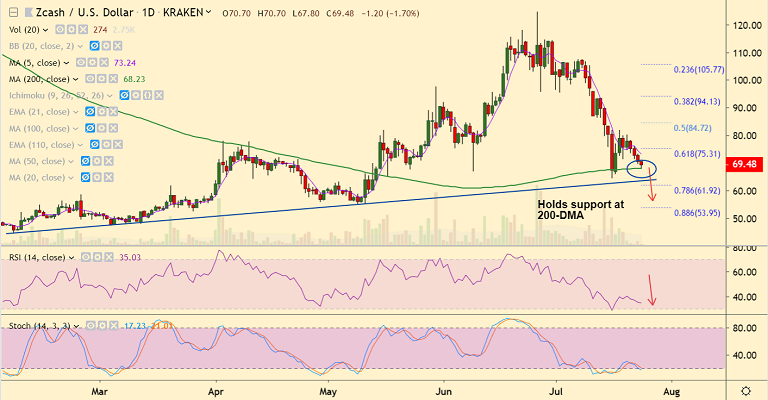
ZEC/USD chart - Trading View
Exchange - Kraken
Technical Analysis: Bias Bearish
Support: 68.23 (200-DMA), 63.50 (trendline support), 61.92 (78.6% Fib)
Resistance: 73.24 (5-DMA), 74.38 (200H SMA), 75.31 (61.8% Fib)
ZCash retests 200-DMA support, break below will see further downside.
Technical indicators are bearish. Price action grinds lower below 200H SMA.
Stochs and RSI are sharply lower. MACD and ADX supports weakness.
GMMA has shown short-term MAs have broken below long-term MAs, bias lower.
Major moving averages have turned lower. Scope for further weakness.
The pair's recovery capped at 110-EMA, break below 200-DMA will see drag till 78.6% Fib at 61.92.
For details on FxWirePro's Currency Strength Index, visit http://www.fxwirepro.com/currencyindex.



FxWirePro- Major Crypto levels and bias summary
FxWirePro- Major Pair levels and bias summary
NZD/JPY Breakout Blast: Kiwi Rocket Smashes 94.50 Resistance, Bulls Lock Sights on 95
Bitcoin Bleeds $704M in ETF Outflows as Institutional Exodus Accelerates
Aussie Yen Breaks 114 Barrier: Bulls Lock Horns With Resistance, Eyes on 115 Summit
FxWirePro- Major Crypto levels and bias summary
USD/CHF Smashes Higher to 0.7899 on Dollar Dominance—Bulls Bet on 0.7865 Dips for 0.8000 Breakout
FxWirePro: GBP/NZD slide extends ,eyes 2.2600 level
FxWirePro: USD/ZAR sell bias remains below key resistance zone
FxWirePro- Major Crypto levels and bias summary
Bitcoin Buckles at $73,500: Middle East Tensions and Weak Institutional Demand Set Bearish EMA Stack on $70K Collision Course 


