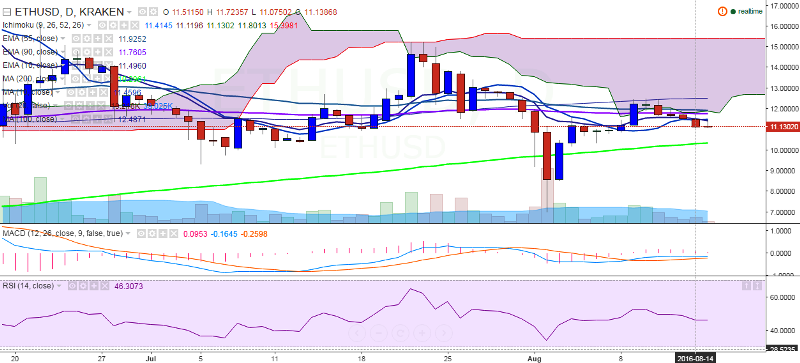
ETH/USD has sharply declined till 11.07 levels, after hitting a high of 12.49 levels on August 10. It is currently trading at 11.20 levels at the time of writing.
Ichimoku analysis of daily chart:
Tenkan Sen: 11.41
Kijun Sen: 11.11
Trend reversal: 11.76 (90 EMA)
The pair has broken below 90 EMA and the short-term trend remains bearish. On the topside, major resistance is seen at 11.76 (90 EMA) and any consistent break above this levels would see the pair testing 12.48 (100-day MA)/13.47 (78.6% retracement of 15.23 and 7).
On the reverse side, 200-day MA is likely to provide support to the pair at 10.29 levels and break below would target 9.09 (61.8% retracement of 7 and 12.49)/7.00.