


 FxWirePro :USD/JPY bulls loosen their grip a bit, dips to be bought
  FxWirePro- Major Crypto levels and bias summary
  FxWirePro: NZD/USD advances as hawkish outlook by a top policy maker boosts kiwi dollar
  FxWirePro: USD/CNY edges lower , bearish outlook persists
  ETHUSD Bullish Momentum: Follows BTC Above All EMAs, Buy Dips Near $1750 Targeting $2300
  GBPJPY Stuck in Tight Range – Neutral Bias Persists Despite Bullish EMAs


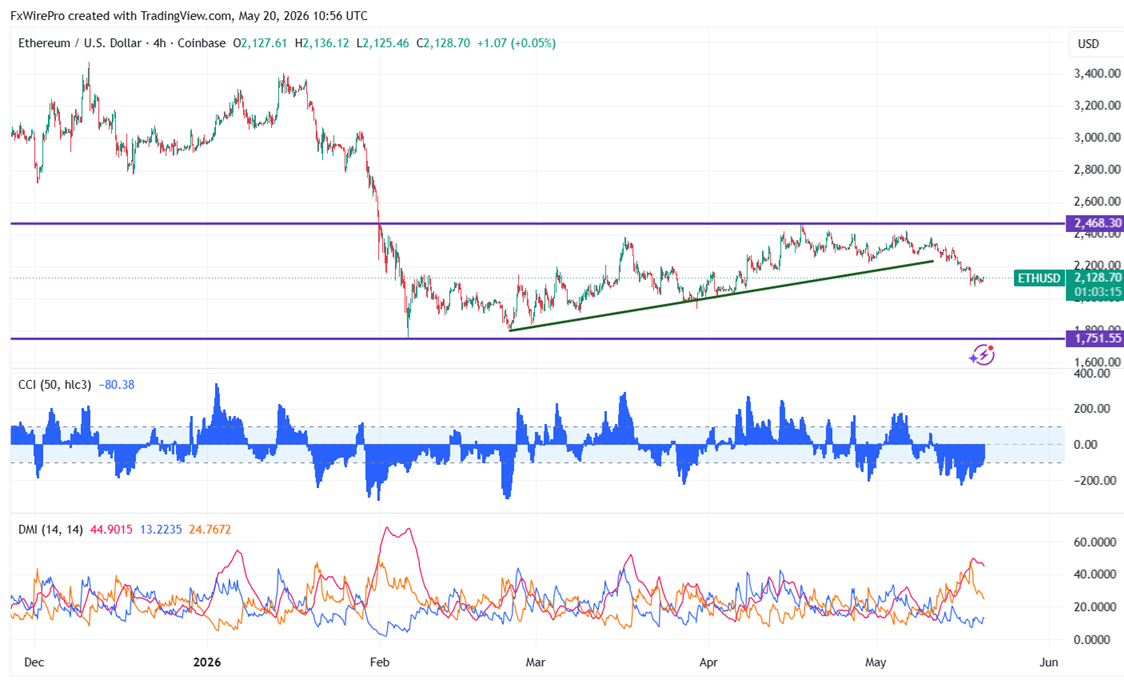
ETHUSD trades well below $2200, following the footsteps of BTC. It reached an low of $2078 and is currently trading at approximately $2130.
|
Technicals |
CMP -$2129 |
Trend |
|
|
4- Hour chart |
Value |
|
|
|
55 EMA |
$2199 |
CMP<55 EMA |
Bearish |
|
200- EMA |
$2254 |
CMP <200- EMA |
Bearish |
|
365- EMA |
$2257 |
CMP <365 EMA |
Bearish |
Major support- $2000/$1700/$1500. Minor bullishness only above $2500. Any violation above targets $2770/$2880/$3000.
|
Momentum indicator (4-hour chart) |
Inference |
Value |
|
CCI(50) |
Bearish |
-91.74 |
|
ADX |
Neutral |
|
It is good to buy on dips around $2200 with SL around $2200 for a TP of $2770.


