


 FxWirePro: USD/ CNY remains soft ahead of Fed decision
  FxWirePro: GBP/AUD gains some upside momentum but still bearish
  Major Forex Pairs Action Bias: GBPUSD and AUDUSD Turn Extremely Bearish
  FxWirePro: GBP/AUD gains above 1.9200 level , upside pressure builds
  JPY Pairs Action Bias: EURJPY Leads as Bullish Standout Amid Mixed Momentum
  FxWirePro: GBP/USD edges lower ahead of Fed policy verdict
  FxWirePro: USD/ CNY hits one-month low,scope for futher downside
  FxWirePro: AUD/USD dips below lower range, bearish bias increases
  FxWirePro: USD/JPY eases ahead of Fed decision , Intervention risks linger
  FxWirePro: USD/CAD runs out of steam but maintains bullish outlook
  FxWirePro- Woodies pivot (Major)
  FxWirePro- Major Crypto levels and bias summary
  FxWirePro: USD/CAD slips after Fed holds rates steady
  FxWirePro- Major Pair levels and bias summary
  EURUSD Spikes to 1.14306 on Fed Pause as Traders Eye Sell-the-Rally Setup


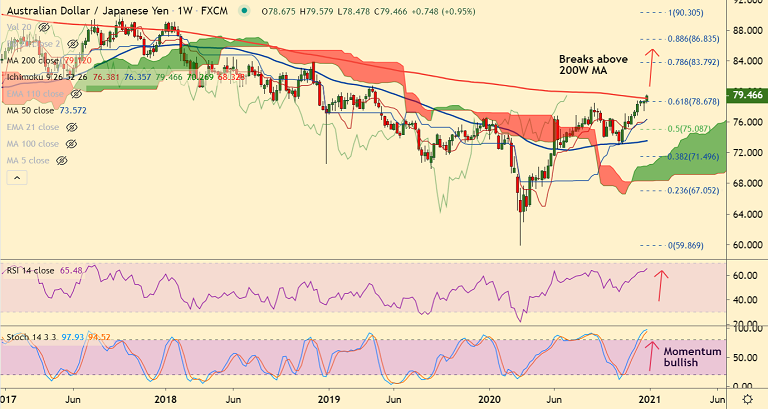
AUD/JPY chart - Trading View
Technical Analysis: Bias Bullish
- AUD/JPY was trading 0.31% higher on the day at 79.51 at around 08:30 GMT, outlook bullish
- Price action has broken above 200W MA at 79.12
- Volatility is rising as evidenced by widening Bollinger bands
- Momentum studies are bullish, Stochs and RSI are sharply higher
- Analysis of GMMA indicator shows major and minor trend are strongly bullish
Support levels - 79.12 (200W MA), 76.44 (21-EMA)
Resistance levels - 80.71 (Apr 2019 high), 83.79 (78.6% Fib)
Summary: The pair trades with a major bullish bias. Close above 200W MA will buoy bulls. Scope then for test of 80.71 (Apr 2019 high). Next major resistance lies at 78.6% Fib at 83.79.


