


 FxWirePro: USD/CAD gaining momentum for a move towards 1.4200 level
  FxWirePro: NZD/USD edges lower, remains on back foot
  FxWirePro: AUD/USD dips after RBA Governor speech
  FxWirePro: GBP/AUD downside pressure builds, key support level in focus
  EUR/USD Bounces from Monthly Low, But Bearish Pressure Remains
  FxWirePro: GBP/NZD gains some ground but bias is still bearish
  EUR/JPY Holds Bullish Bias as Euro Extends Recovery
  NZDJPY Pullback: Sell Rallies Toward 93.30 as Yen Weakness Eases
  Major Pairs Action Bias: USDCAD and USDCHF Stand Out as Extremely Bullish While GBPUSD and NZDUSD Turn Extremely Bearish
  FxWirePro: USD/ZAR retreats but trend is still bullish
  FxWirePro: GBP/NZD maintains bersish bias with focus on 2.2900 level
  FxWirePro: USD/CAD runs out of steam but maintains bullish outlook
  FxWirePro: GBP/AUD gains some upside momentum but still bearish
  FxWirePro: NZD/USD neutral in the near-term, scope for downward resumption
  FxWirePro: USD/JPY eases ahead of Fed decision , Intervention risks linger


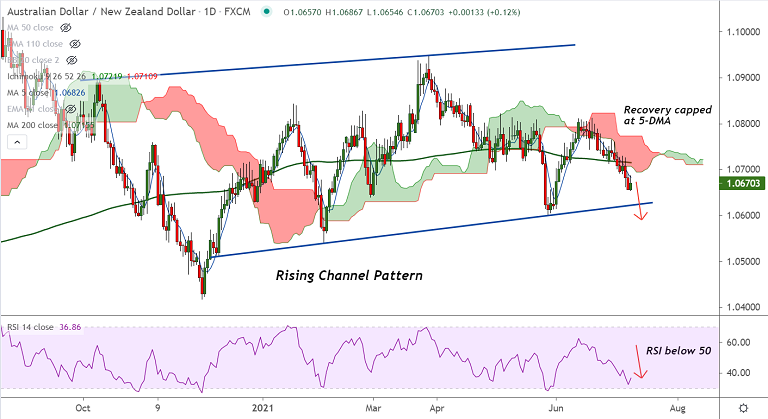
AUD/NZD chart - Trading View
AUD/NZD was trading 0.14% higher on the day at 1.0672 at around 09:15 GMT.
The pair has paused downside, but recovery attempts lack traction, upside capped at 5-DMA.
MACD is biased lower and is below the zero mark. ADX is rising with -ve DMI dominance, supporting downside.
Bollinger bands are wide suggesting volatility is high and rising. Momentum indicators show bearish bias.
Price action is consolidating break below 200-week MA, bias bearish as long as pair holds below 200-week MA.
GMMA indicator shows major and minor trend are bearish on the daily and intraday charts.
Support levels - 1.0625 (Channel base), 1.06 (May 27 low), 1.0540 (Feb low)
Resistance levels - 1.0682 (5-DMA), 1.0715 (200 DMA), 1.0736 (55-EMA)
Summary: AUD/NZD was trading with a bearish bias. Recovery lacks traction, scope for test of channel base at 1.0625.


