


 FxWirePro- Major Crypto levels and bias summary
  FxWirePro: GBP/NZD maintains bersish bias with focus on 2.2900 level
  EURUSD Spikes to 1.14306 on Fed Pause as Traders Eye Sell-the-Rally Setup
  FxWirePro: GBP/AUD gains above 1.9200 level , upside pressure builds
  FxWirePro- Woodies pivot (Major)
  FxWirePro: USD/JPY eases ahead of Fed decision , Intervention risks linger
  NZD/JPY Flatlines Near 94.60: Will Key Support Reignite the Uptrend?
  FxWirePro: NZD/USD neutral in the near-term, scope for downward resumption
  FxWirePro- Major Pair levels and bias summary
  FxWirePro: USD/CAD runs out of steam but maintains bullish outlook
  EUR/JPY Holds Bullish Bias as Euro Extends Recovery
  FxWirePro: USD/ZAR firms ahead of Fed interest rate decision
  FxWirePro:EUR/NZD gains some upside momentum but still bearish
  FxWirePro: EUR/AUD regains upwards momentum but unable to hold above 50%fib level
  FxWirePro: GBP/USD edges lower ahead of Fed policy verdict
  FxWirePro- Major Pair levels and bias summary


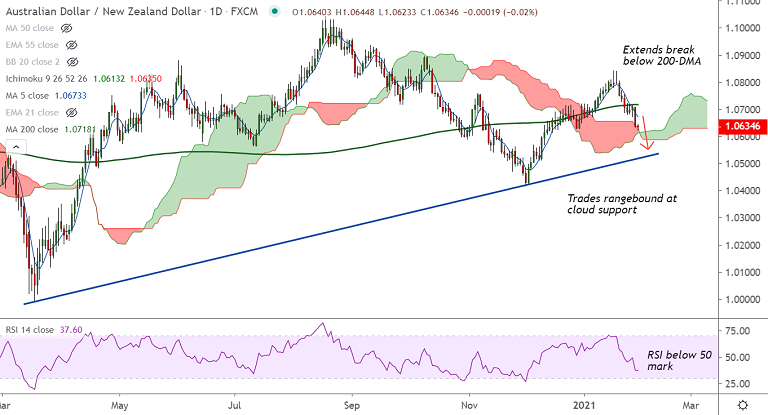
AUD/NZD chart - Trading View
Technical Analysis: Bias Bearish
- AUD/NZD has confirmed break below 200-DMA
- Price action is below major moving averages
- GMMA shows bearish shift in near-term moving averages
- Volatility is rising as evidenced by widening Bollinger bands
- Momentum is strongly bearish with Stochs and RSI sharply lower
Support levels - 1.0613 (daily cloud), 1.0525 (rising trendline), 1.0484 (Apr 21, 2020 low)
Resistance levels - 1.0675 (5-DMA), 1.0684 (200W MA), 1.0718 (200-DMA)
Summary: AUD/NZD is trading rangebound on the day with session high at 1.0644 and low at 1.0623. Technical bias has shifted bearish and the price action is extending break below 200-DMA. Daily cloud offers strong support. Break below will drive prices lower.


