
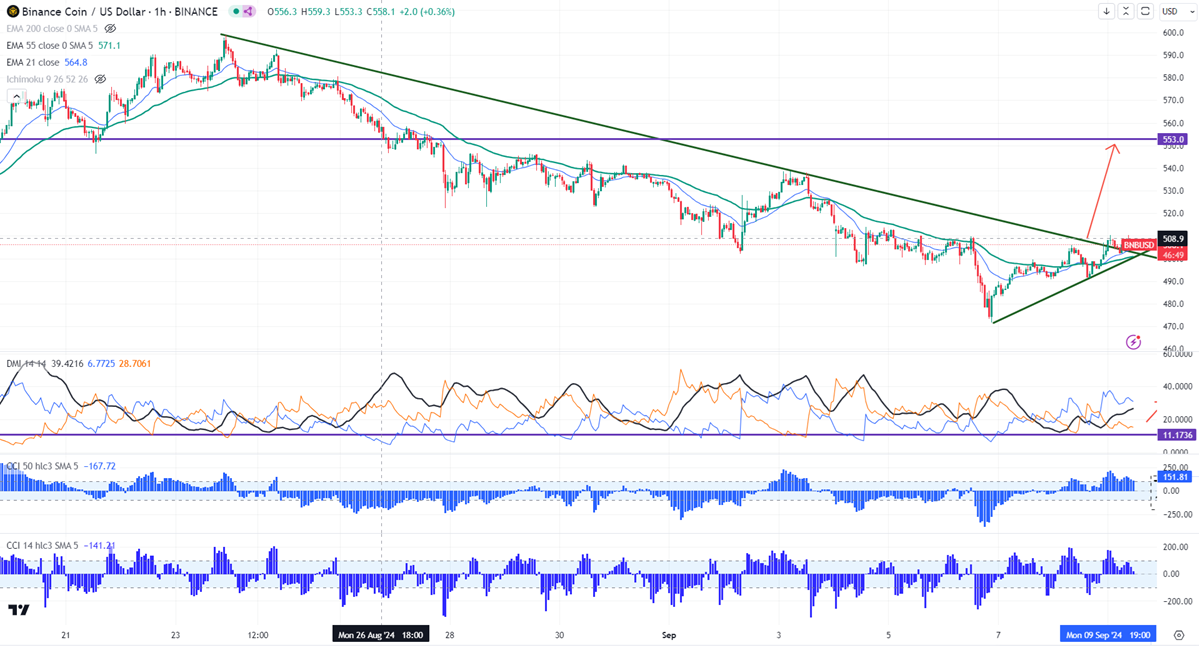
Intraday bias - Bullish
Horizontal trend line- $605
Any close above $555 confirms intraday bullishness.
BNBUSD surged more than 8% from a minor bottom of $473. The pair holds above 34 and 55 EMA in the 4-hour chart. It hit a high of $510 and is currently trading around $506.90.
The intraday bearish trend continuation can happen if the pair breaks $470. On the lower side, the near-term support is $470. Any break below targets $450/$403 is possible.
The immediate resistance stands at around $520.10 (200-day EMA). Any breach above confirms minor bullishness. A jump to $541/$553 is possible. Bullish continuation only if it breaks $553. A surge past $553 will take it to $605/$700.
Indicators ( Hourly chart)
Directional movement index -Bullish
CCI (50)- Bullish
CCI(14)- Bullish
It is good to buy on dips around $500 with SL around $470 for TP of $605.


