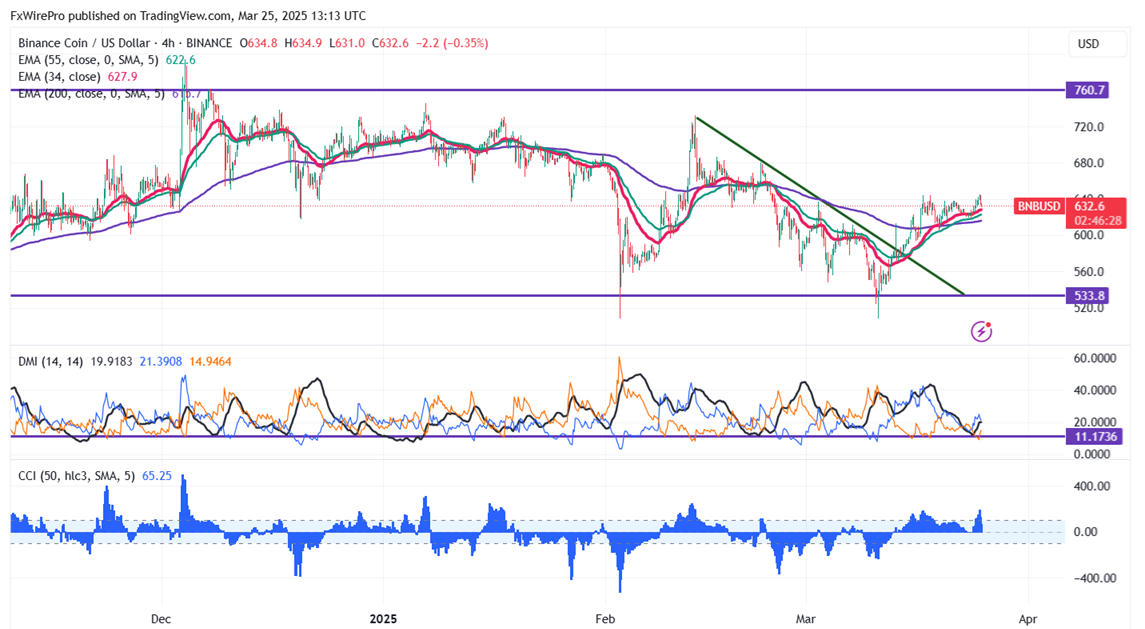
BNB/USD is consolidating in a narrow range between $645.30 and $605 for the past one week. It hit an intraday low of $631 and is currently trading around $632.30.
Overall bias remains bullish as long as support $500 holds. It trades above the 34 and 55 EMA on the 4-hour chart. If the pair closes below $500, potentially leading to further declines towards $400.
Immediate Resistance is at $645. A successful breakout above this resistance could suggest bullish momentum, with further gains possible towards $678/$700/$730.
Indicators (4-Hour Chart)
- Directional Movement Index: Neutral
- CCI (50): Bullish
Trading Strategy
It is good to buy above $645 with a stop-loss set at $600 and a target price of $730.



FxWirePro: USD/CAD slips as Canadian dollar firms on hopes for US-Iran ceasefire deal
FxWirePro- Major Crypto levels and bias summary
FxWirePro: GBP/USD recovers some ground but bears are not done yet
FxWirePro: GBP/NZD extends decline , vulnerable to more downside
FxWirePro- Woodies pivot (Major)
FxWirePro: USD/CNY bears maintain upper hand
FxWirePro: EUR/AUD downward momentum remains in place
FxWirePro: GBP/AUD downside pressure builds, key support level in focus
FxWirePro: GBP/USD edged higher as hopes for US-Iran deal boost riskier assets
FxWirePro: USD/ZAR sell bias remains below key resistance zone
FxWirePro- Major Pair levels and bias summary
Bitcoin Bleeds $704M in ETF Outflows as Institutional Exodus Accelerates 


