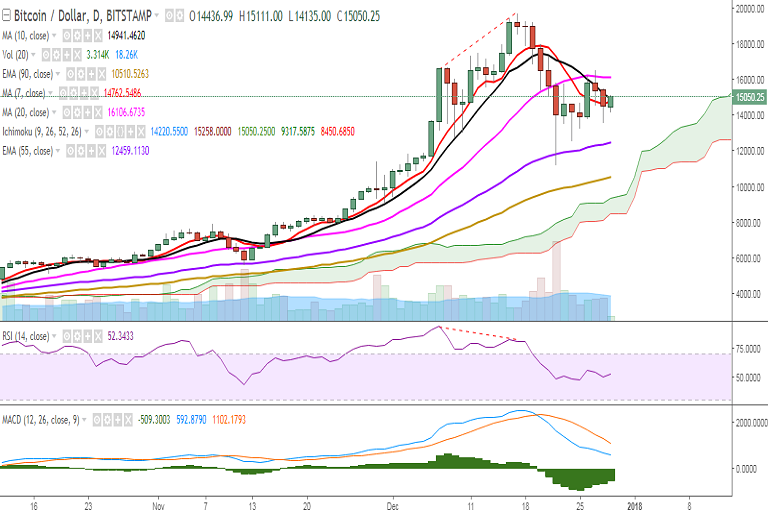
BTC/USD is trading in the green on Friday after it dropped to 13500 levels on December 28. It is currently trading at 14949 levels at the time of writing (Bitstamp).
Ichimoku analysis of daily chart:
Tenkan Sen: 14220.55
Kijun Sen: 15258
On the topside, a consistent break above 14931 (10-DMA) would see the pair testing 15000/15412 (50% retracement of 19666 and 11159). Further strength would target 16104 (20-DMA)/16666 (December 08 high)/17000.
On the reverse side, support is likely to be found at 14688 (1h 200-SMA) and a decisive break below would drag the pair to 14275 (38.2% retracement of 5555.55 and 19666)/14000/13500 (December 28 low). Further weakness would see it testing 13052 (1w 7-SMA)/12610.
Momentum studies: On the daily chart, RSI is holding above 50, while MACD line is below the signal line. Further bullishness could be confirmed only on a decisive break above 20-DMA.
Bias appears bullish on the intraday charts.
On the weekly chart, stochs are on the verge of a rollover from the overbought zone, RSI is holding at 70, and MACD line is above the signal line.
Traders are preferred to wait for a confirmed signal on the daily charts.
FxWirePro launches Absolute Return Managed Program. For more details, visit http://www.fxwirepro.com/invest