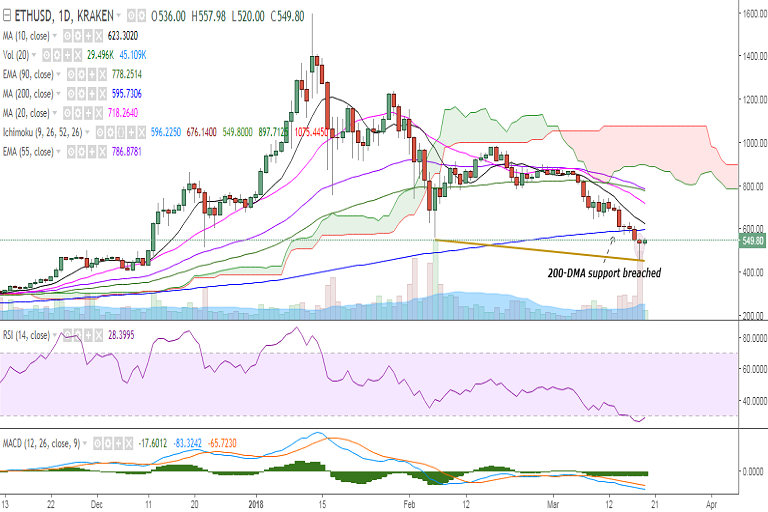
ETH/USD dropped to 453 levels on March 18 as it broke below 200-DMA. It is currently trading at 546 levels at the time of writing (Kraken).
On the upside, resistance is seen at 595 (200-DMA) and a break above would see it testing 622 (10-DMA)/669 (4h 90-EMA). Further strength would target 707 (4h 100-SMA)/718 (20-DMA)/778 (90-EMA)/800.
On the downside, a break below 490 (lower Bollinger) would target 450 (trend line joining 556 and 453))/439 (127.2% retracement of 556 and 983.85). Further weakness would drag it to 400/353 (1w 90-EMA).
Momentum studies: Bias appears bearish on the daily chart with the pair’s upside capped by 10-DMA and MACD line below the signal line.
However, stochs appear to be on the verge of a rollover from oversold levels and RSI is also showing a turn from the o/s zone. Also, the hammer pattern on the daily chart suggests the end of the downtrend.
Call Update: We recommended staying short in our previous call. All the targets have been hit.
Recommendation: Wait for clear directional bias.
FxWirePro launches Absolute Return Managed Program. For more details, visit http://www.fxwirepro.com/invest