


 FxWirePro: GBP/AUD gains above 1.9200 level , upside pressure builds
  FxWirePro: AUD/USD dips below lower range, bearish bias increases
  FxWirePro- Woodies pivot (Major)
  FxWirePro: GBP/NZD maintains bersish bias with focus on 2.2900 level
  FxWirePro- Major Pair levels and bias summary
  FxWirePro: EUR/ AUD gains some ground , but remains on bearish path
  FxWirePro: USD/ZAR firms ahead of Fed interest rate decision
  FxWirePro- Major Crypto levels and bias summary
  FxWirePro: USD/JPY edges higher as focus shifts to BOJ decision
  FxWirePro- Major Pair levels and bias summary
  JPY Pairs Action Bias: EURJPY Leads as Bullish Standout Amid Mixed Momentum
  FxWirePro:EUR/NZD gains some upside momentum but still bearish
  FxWirePro : GBP/NZD strongly bearish despite upside attempts
  FxWirePro: USD/CAD slips after Fed holds rates steady
  NZD/JPY Flatlines Near 94.60: Will Key Support Reignite the Uptrend?


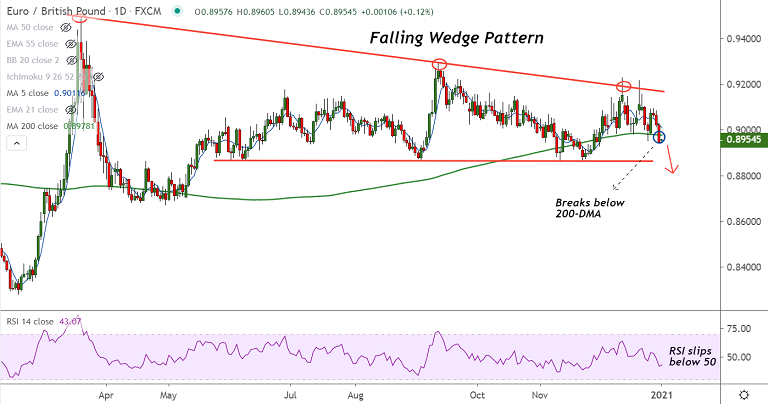
EUR/GBP chart - Trading View
Technical Analysis: Bias Bearish
- EUR/GBP closed below 200-DMA on December 31st trade opening downside
- Volatility is rising as evidenced by widening Bollinger bands
- Price has slipped below daily cloud adding to the downside bias
- Stochs and RSI are strongly bearish, RSI is now below the 50 mark
- Analysis of GMMA indicator shows minor trend has turned bearish
Support levels - 0.8924 (50W MA), 0.8887 (weekly cloud base), 0.8828 (200W MA)
Resistance levels - 0.8978 (200-DMA), 0.9010 (converged 110-EMA and 5-DMA), 0.9021 (55-EMA)
Summary: EUR/GBP shows signs of weakness. Break below 200-DMA has opened downside for the pair. Scope for test of 200W MA at 0.8828.


