


 FxWirePro: USD/CAD slips after Fed holds rates steady
  FxWirePro: GBP/AUD gains above 1.9200 level , upside pressure builds
  FxWirePro: NZD/USD firms as Kiwi gains on strong ANZ business outlook data
  JPY Action Bias: EURJPY and CADJPY Emerge as Extremely Bullish Pairs to Watch
  FxWirePro: USD/CAD runs out of steam but maintains bullish outlook
  FxWirePro- Major Pair levels and bias summary
  FxWirePro: USD/ CNY hits one-month low,scope for futher downside
  FxWirePro: GBP/USD edges lower ahead of Fed policy verdict
  FxWirePro:EUR/NZD gains some upside momentum but still bearish
  FxWirePro- Major Crypto levels and bias summary
  FxWirePro : GBP/NZD strongly bearish despite upside attempts
  FxWirePro: GBP/NZD maintains bersish bias with focus on 2.2900 level
  FxWirePro: USD/ZAR firms ahead of Fed interest rate decision
  FxWirePro: AUD/USD dips below lower range, bearish bias increases
  FxWirePro: USD/JPY eases ahead of Fed decision , Intervention risks linger
  FxWirePro: AUD/USD falls after softer-than-expected Australian Q2 CPI
  FxWirePro: EUR/ AUD gains some ground , but remains on bearish path


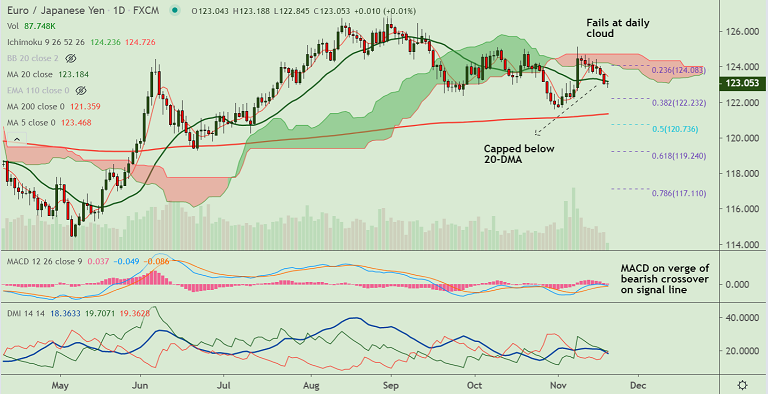
EUR/JPY chart - Trading View
Technical Analysis: Bias Bearish
- Price action has resumed weakness after failure to break above daily cloud
- 5-DMA is sharply lower and recovery attempts capped below 20-DMA
- MACD is on verge of bearish crossover on signal line
- GMMA indicator shows major trend is neutral, while minor trend has turned bearish
- Volatility is high, momentum is bearish, Stochs and RSI are biased lower, RSI is below 50
Support levels - 122.23 (38.2% Fib), 121.35 (200-DMA), 121
Resistance levels - 123.18 (20-DMA), 123.46 (5-DMA), 124.08 (23.6% Fib)
Summary: EUR/JPY is extending weakness after price action failed to break above daily cloud. More weakness likely as price action slips below 110-EMA and recovery seems to be capped below 20-DMA.


