


 JPY Pairs Action Bias: EURJPY Leads as Bullish Standout Amid Mixed Momentum
  FxWirePro: GBP/USD edges lower ahead of Fed policy verdict
  FxWirePro: NZD/USD neutral in the near-term, scope for downward resumption
  Major Forex Pairs Action Bias: GBPUSD and AUDUSD Turn Extremely Bearish
  FxWirePro: USD/CAD runs out of steam but maintains bullish outlook
  FxWirePro: GBP/USD edges higher as traders await BoE guidance and UK fiscal clarity
  FxWirePro- Major Crypto levels and bias summary
  EUR/JPY Holds Bullish Bias as Euro Extends Recovery
  FxWirePro : GBP/NZD strongly bearish despite upside attempts
  FxWirePro: USD/CAD slips after Fed holds rates steady
  FxWirePro: AUD/USD falls after softer-than-expected Australian Q2 CPI
  FxWirePro- Major Pair levels and bias summary
  FxWirePro: EUR/AUD regains upwards momentum but unable to hold above 50%fib level
  Buy the Dips on EUR/JPY: Bullish Structure Points to 188 Target Ahead of Fed
  FxWirePro- Woodies pivot (Major)
  FxWirePro: GBP/NZD maintains bersish bias with focus on 2.2900 level


, outlook bullish - EconoTimes)


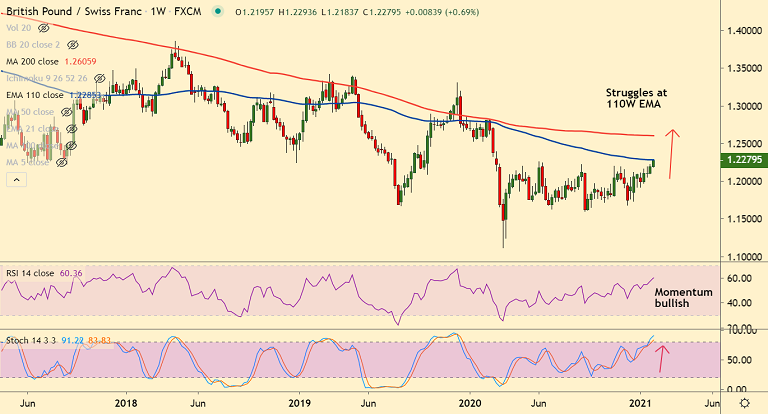
GBP/CHF chart - Trading View
Technical Analysis: Bias Bullish
- GBP/CHF has edged above weekly cloud, close above will support further gains
- Price action has spiked past 50% Fib after pair confirmed 'Symmetric Triangle' breakout
- Momentum strongly bullish, RSI support strong uptrend being above 65 mark
- MACD and ADX support upside in the pair, volatility is rising as evidenced by widening Bollinger bands
- GMMA indicator shows major and minor trend are strongly bullish on daily and weekly charts
Support levels - 1.2213 (converged weekly cloud, 5-DMA and 50% Fib), 1.22, 1.2130 (21-EMA)
Resistance levels - 1.2285 (110W EMA), 1.23, 1.2471 (61.8% Fib)
Summary: GBP/CHF trades with a strong bullish bias. Price action is currently struggling to get past 110W EMA resistance at 1.2285. Decisive break above will buoy prices. Scope then for test of 61.8% Fib at 1.2471.


