


 With Iran and the US signing a peace deal, where does that leave Benjamin Netanyahu?
  Gold's 365-Day EMA Streak Since Oct 2023 Faces Its First Real Test at $3,980 — Break or Bounce to $4,140?
  World Cup technology: from ref cams to AI analysts, cutting-edge research is changing the game
  Today’s space race could turn fatal if we don’t agree on new rules
  AI Memory Boom Sparks Global Chip Supply Crunch
  Gold Surges Above Key EMAs, Bulls Eye Resistance Amidst Bullish Momentum
  Sell the Bounce": Gold Rally Stalls Near $4165 as Fed Hawks Slam the Door on Rate Cuts — Targets $4000/$3600
  Silver Cracks Key 365-Day EMA for First Time Since Feb 2024; Bears Eye $50 on Rallies
  Morgan Stanley Sees Chinese Auto Market Recovery Gaining Momentum in Late Summer
  J.P. Morgan Sees Potential Vestas Guidance Upgrade Amid Strong Wind Energy Demand


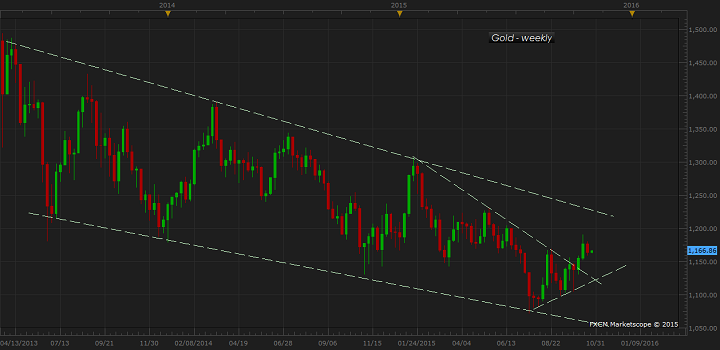
Gold has technically broken a short term resistance line about little more than two weeks back which saw the yellow metal to appreciate from $1150 region break to as high as $1190 area.
However bears are still at large since gold is still trading within its large bearish channel as shown in the figure and latest buying is not surprising given the bounce back from channel floor. The bearish downward sloping channel has been in place since April, 2013.
Any meaningful trend is unlikely to appear over next two trading days as FED decision is looming on 28th October.
Friday's price action that saw sharp selloff in Gold from $1179 area to close around $1164/troy ounce, shows that beards are still at large, which might push Gold to test the interim rising trend line, that has been in place since July this year and pushed Gold to break 8 month long bearish resistance line.
Trade idea -
- It is better to speculate with small position ahead of FED.
- Bears might push Gold towards support line around $1125-1130 area if FED sounds relatively hawkish, which if holds might led gold towards $1200 once more.
Gold is currently trading at $1165/troy ounce.


