


 Gold Prices Fall Amid Rate Jitters; Copper Steady as China Stimulus Eyed


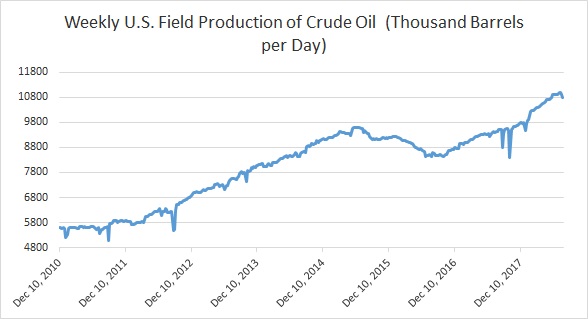
Here are some key charts based on data from the United States’ Energy Information Agency’s (EIA) latest report that explains the level of inventories, refinery demand, and production.
- Chart 1 shows crude oil production in the United States which after reaching an all-time high of 11 million barrels per day, declined for two consecutive weeks to 10.8 million barrels per day.
- Chart 2 shows the level of U.S. distillate inventories. It has been rising lately after a rapid decline in 2017. According to the latest report, the inventory rose to 125.4 million barrels.
- U.S. oil imports have been declining over the past couple of year. However, it has gone up rapidly in recent times thanks to higher refinery demand. Last week, it rose to 7.93 million barrels per day. It has been showing a lot of volatility lately.
- Chart 4 shows the level of U.S. crude oil exports, which rose last week to 1.85 million barrels per day. It reached a record high of 3 million barrels per day, in June.
- Chart 5 shows U.S. refinery operating at 96.6 percent capacity, slightly down from its highest level in more than a decade.
- Chart 6 shows the level of crude oil inventories, which has declined around 127 million barrels since its peak in April 2017. Inventories declined last week to 407.4 million barrels.


